Top Cloud-agri TP-plant-HIPS High-Spectral Plant Phenotyping Platform
| Brand | Top Cloud-agri |
|---|---|
| Origin | Zhejiang, China |
| Manufacturer Type | OEM/ODM Manufacturer |
| Country of Origin | China |
| Model | TP-plant-HIPS (Hyperspectral) |
| Imaging Wavelength Range | 400–1000 nm |
| Spectral Bands | ≥1200 |
| Spatial Resolution | Sub-millimeter (field-dependent) |
| Acquisition Time | ≤40 s per potted plant |
| Analysis Time | ≤30 s per plant |
| Power Consumption | <1 kW (typical operating load: ~500 W) |
| Enclosure Dimensions | 1400 × 935 × 1840 mm (L×W×H) |
| Light Source | Low-flicker, high-CRI halogen illumination system |
| ROI-Based Spectral Extraction | Yes |
| Vegetation Index Computation | NDVI, RVI, GVI, WBI, CCCI, NRI, and custom index support |
| Built-in Biophysical Inversion Models | Chlorophyll content (SPAD-equivalent), canopy nitrogen concentration |
| Data Linkage | QR-code-based sample metadata association |
| Software Interface | Touch-enabled GUI with integrated acquisition, reconstruction, and analysis workflow |
Overview
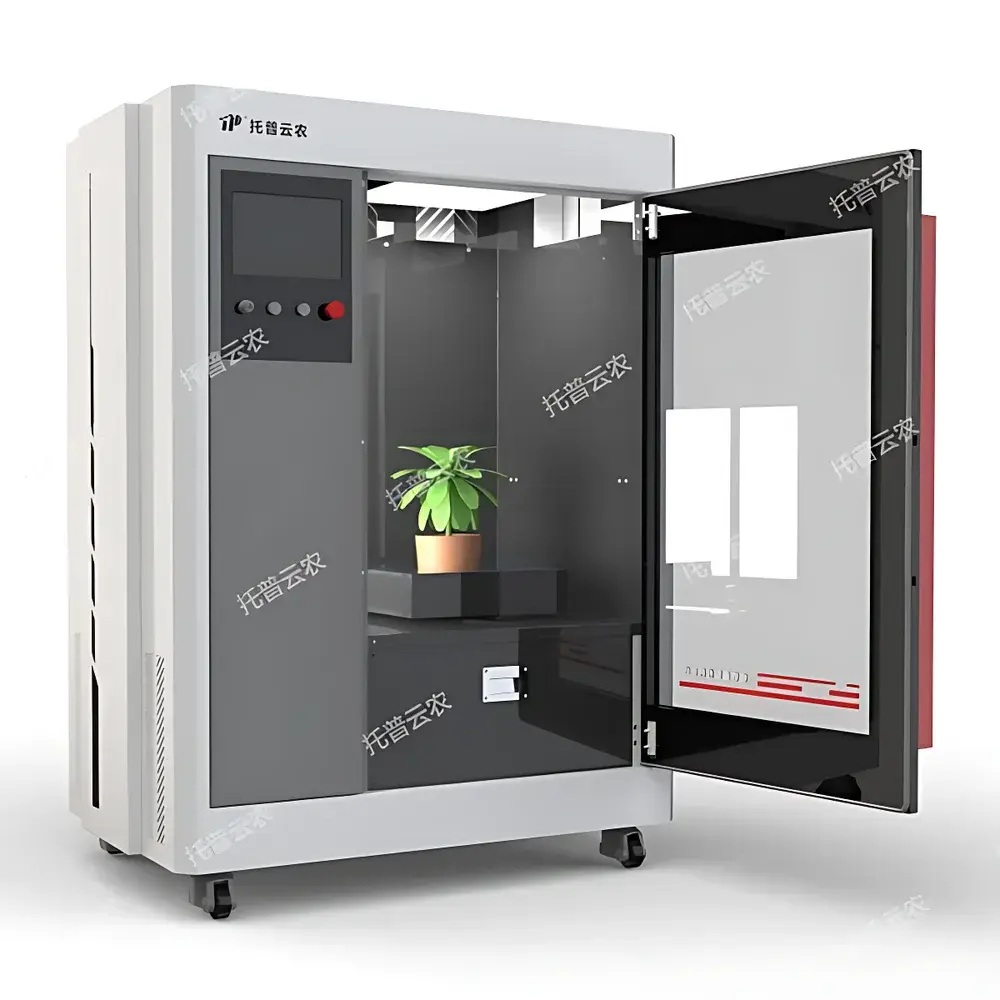
The Top Cloud-agri TP-plant-HIPS High-Spectral Plant Phenotyping Platform is a laboratory-grade, top-view hyperspectral imaging system engineered for non-destructive, quantitative phenotypic characterization of potted plants under controlled conditions. It operates on the principle of reflectance-based hyperspectral imaging—capturing contiguous spectral signatures across the visible to near-infrared (VIS-NIR) range (400–1000 nm) at ≥1200 narrow spectral bands. This enables pixel-wise spectral unmixing and biophysical parameter inversion without physical sampling or chemical reagents. Designed for reproducible, high-throughput screening in academic and breeding laboratories, the platform integrates a motorized vertical translation stage with a fixed-position hyperspectral line-scan camera, ensuring consistent working distance and illumination geometry across acquisitions. Its architecture supports standardized experimental protocols aligned with FAO and CGIAR phenotyping best practices, facilitating data comparability across multi-site trials and longitudinal studies.
Key Features
- Top-down hyperspectral imaging configuration with automated height adjustment (±50 mm range) to maintain optimal optical path length for diverse plant architectures (rosette, erect, bushy).
- Low-flicker, high-color-rendering-index (CRI >95) halogen illumination system ensures stable radiometric output and minimizes photobiological stress during acquisition.
- Integrated touch-enabled control interface allows real-time adjustment of lighting intensity, stage position, and preview window zoom—without requiring external PCs or command-line input.
- Sub-second per-frame acquisition synchronized with precision motor control yields full-plant spectral cubes (x, y, λ) in ≤40 seconds per specimen.
- Onboard preprocessing pipeline performs dark-current correction, flat-field normalization, and geometric rectification prior to export.
- Modular software architecture supports both out-of-the-box vegetation index mapping (NDVI, CCCI, NRI, etc.) and user-defined spectral band ratio models via Python API integration.
- QR-code–driven sample metadata binding ensures traceability from physical pot to spectral dataset—critical for GLP-compliant trait validation workflows.
- Self-contained enclosure (1400 × 935 × 1840 mm) features casters and lockable leveling feet for flexible placement in growth chambers, phytotrons, or shared core facilities.
Sample Compatibility & Compliance
The TP-plant-HIPS accommodates standard horticultural pots (up to 30 cm diameter) and supports upright, semi-prostrate, and compact growth forms typical of Arabidopsis thaliana, rice (Oryza sativa), tomato (Solanum lycopersicum), maize (Zea mays), and leguminous species. Sample handling requires no mounting fixtures or leaf clipping—ensuring physiological integrity throughout time-series experiments. The system complies with IEC 61000-6-3 (EMC emissions) and IEC 61000-6-2 (immunity) standards. While not certified for clinical or pharmaceutical use, its data structure adheres to MIAPPE (Minimum Information About a Plant Phenotyping Experiment) v1.1 metadata schema, enabling interoperability with BreedBase, BrAPI, and ELIXIR Plant Sciences infrastructure. All spectral calibrations are traceable to NIST-traceable reflectance standards (e.g., Spectralon® 99% white reference).
Software & Data Management
The proprietary HIPS-Analyze Suite provides a unified environment for acquisition control, spectral cube visualization, region-of-interest (ROI) definition, and biophysical parameter derivation. Core capabilities include interactive spectral curve extraction per pixel or user-drawn ROI; pseudo-color rendering of vegetation indices and inverted parameters (chlorophyll density, nitrogen concentration); statistical summary (mean, SD, CV) per ROI; and batch export to HDF5, ENVI .hdr/.img, or GeoTIFF formats. Audit trails record operator ID, timestamp, instrument settings, and processing steps—supporting 21 CFR Part 11–aligned electronic record integrity where configured with network-authenticated login. Custom model deployment (e.g., disease severity classifiers) is enabled via scikit-learn–compatible pipelines trained on user-supplied ground-truth datasets. Exported data conforms to ISA-Tab specifications for submission to public repositories such as Phenome-FPPN or EGA.
Applications
- Mutation screening: Quantitative discrimination of subtle spectral shifts associated with chlorophyll biosynthesis mutants or nutrient transporter knockouts.
- Abiotic stress phenotyping: Time-resolved tracking of water deficit (via WBI), salinity (via CCCI/NRI divergence), and thermal stress (via red-edge inflection point shifts).
- Disease progression monitoring: Pixel-level classification of early infection zones using spectral angle mapper (SAM) against healthy tissue templates.
- Nutrient use efficiency (NUE) assessment: Correlation of canopy-level nitrogen maps with destructive Kjeldahl assays to validate non-invasive prediction accuracy.
- Breeding pipeline integration: High-throughput scoring of segregating populations for spectral biomarkers linked to yield-associated QTLs.
- Ecophysiological modeling: Input of spatially resolved reflectance data into PROSAIL or SCOPE radiative transfer simulations for canopy-scale gas exchange estimation.
FAQ
What spectral resolution does the TP-plant-HIPS achieve?
The system delivers continuous spectral sampling across 400–1000 nm with effective spectral resolution ≤3 nm FWHM, determined by the grating dispersion and slit width of the imaging spectrometer.
Can it be used for field-deployed measurements?
No—it is designed exclusively for controlled-environment use (growth chambers, greenhouses, labs). Outdoor operation would compromise radiometric stability due to uncontrolled irradiance and atmospheric scattering.
Is raw hyperspectral cube data accessible for third-party analysis?
Yes. Fully calibrated radiance cubes (in radiometrically corrected digital numbers) are exported in open formats (HDF5, ENVI) with embedded wavelength and geometry metadata.
Does the system support kinetic time-series acquisition?
Yes—scheduled acquisition sequences (e.g., every 2 hours over 7 days) can be programmed with automatic file versioning and timestamp embedding.
How is calibration maintained between sessions?
Daily dark-frame and white-reference acquisitions are recommended; factory calibration certificates include spectral and radiometric uncertainty budgets traceable to NIST standards.