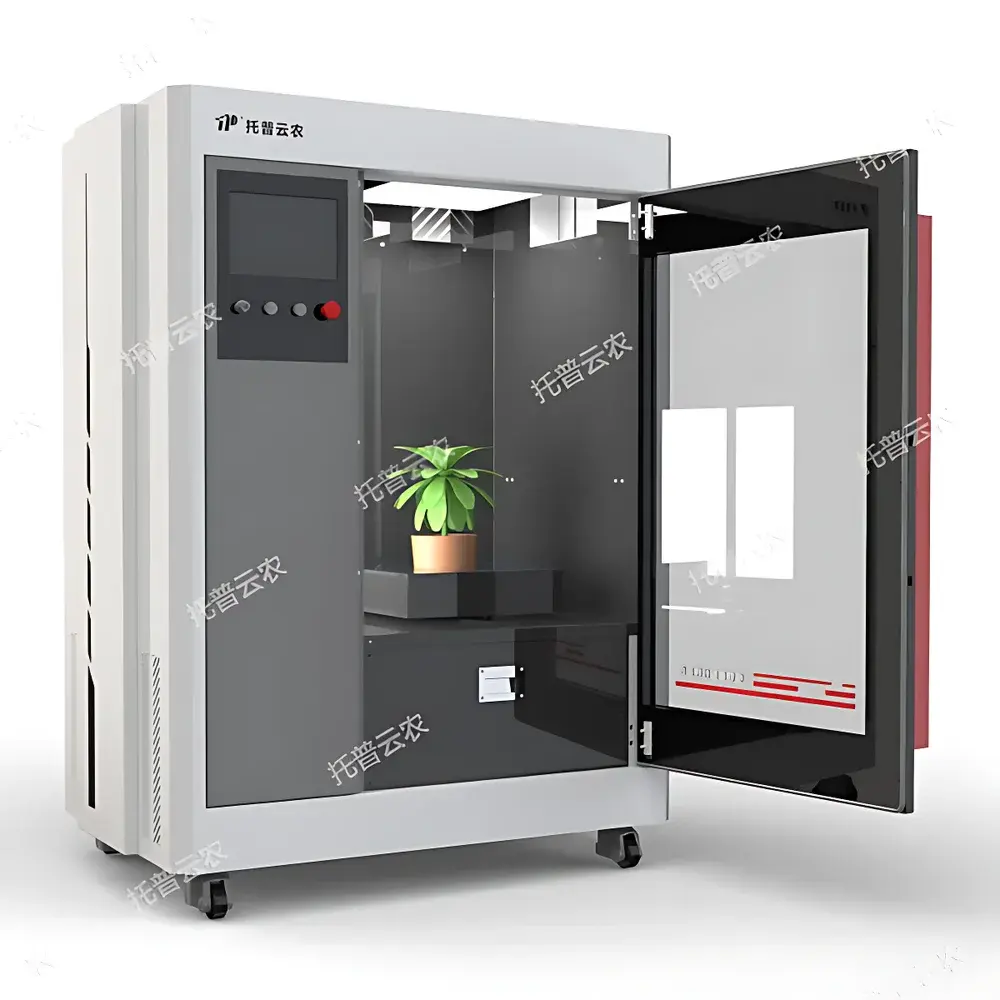
Top Cloud-agri TP-plant-VL3 3D Digital Plant Phenotyping System for Potted Plants
| Brand | Top Cloud-agri |
|---|---|
| Origin | Zhejiang, China |
| Manufacturer Type | Direct Manufacturer |
| Country of Origin | China |
| Model | TP-plant-VL3 (3D) |
| Pricing | Upon Request |
| Imaging Resolution | 5120 × 5120 pixels |
| Light Source | Uniform Diffuse LED Panel |
| Power Consumption | <1 kW (approx. 500 W) |
| Enclosure Dimensions | 1400 mm (L) × 935 mm (W) × 1840 mm (H) |
| Key Metrics | Canopy Height, Crown Width, Plant Volume, Surface Area, Leaf Area (Top/Side), Convex Hull Area (Top/Side), Leaf Rolling Index, Greenness Retention, Senescence Level, Compactness, Eccentricity, Biomass Estimation |
Overview
The Top Cloud-agri TP-plant-VL3 3D Digital Plant Phenotyping System is a laboratory-grade, non-invasive imaging platform engineered for high-throughput, quantitative phenotypic characterization of potted plants under controlled indoor environments—including growth chambers, climate rooms, and phenotyping labs. It employs multi-view stereo (MVS) photogrammetry combined with structured visible-light imaging to reconstruct geometrically accurate, texture-rich 3D plant models from synchronized top- and side-view image sequences. Unlike laser-based or time-of-flight systems, the TP-plant-VL3 relies on passive optical triangulation and dense correspondence matching across calibrated views, enabling robust reconstruction of complex, self-occluding foliage without depth sensor noise or motion artifacts. The system is optimized for longitudinal monitoring—capturing morphological, textural, and chromatic dynamics across developmental stages or stress treatments—with sub-millimeter spatial fidelity in volumetric estimation and repeatable pixel-level color calibration under standardized diffuse illumination.
Key Features
- Multi-angle visible-light imaging: Dual-axis acquisition via top-mounted and lateral industrial cameras (5120 × 5120 resolution), synchronized with a precision 360° motorized turntable for complete circumferential coverage.
- Automated 3D reconstruction pipeline: Integrates feature extraction, sparse-to-dense matching, depth map fusion, and mesh optimization to generate watertight, textured 3D models compliant with standard OBJ/PLY export formats.
- Sub-3-minute per-plant workflow: Image capture completed in ≤40 seconds; full 3D reconstruction and trait quantification delivered within 3 minutes—enabling daily time-series profiling of large-scale mutant or treatment cohorts.
- Integrated sample traceability: QR-code scanning links physical pots to digital records, ensuring audit-ready metadata association for GLP-compliant experimental design and replication tracking.
- Touch-enabled control interface: Full-color 10.1″ capacitive display supports real-time preview, lighting intensity adjustment (0–100% dimming), turntable positioning, and manual intervention during acquisition.
- Modular enclosure design: Self-contained cabinet (1400 × 935 × 1840 mm) with casters and internal thermal management, suitable for flexible deployment across lab benches, growth room aisles, or mobile phenotyping units.
Sample Compatibility & Compliance
The TP-plant-VL3 accommodates standard pot sizes (7–15 cm diameter) and supports rosette, erect, and semi-prostrate architectures across major model and crop species—including Arabidopsis thaliana, rice (Oryza sativa), tomato (Solanum lycopersicum), soybean (Glycine max), and Brassica napus. Its visible-light-only modality avoids regulatory constraints associated with X-ray or NIR radiation, making it suitable for routine use in academic, breeding, and contract research facilities without special licensing. Data outputs conform to MIAPPE (Minimum Information About a Plant Phenotyping Experiment) metadata standards, and software logs include timestamped acquisition parameters, lighting conditions, and user identifiers—supporting alignment with ISO/IEC 17025 documentation requirements for accredited testing laboratories.
Software & Data Management
The proprietary PhenotypeStudio v3.2 software provides an integrated, single-click workflow—from image capture and 3D reconstruction to trait extraction and statistical visualization. All processing occurs locally; no cloud upload is required, preserving data sovereignty. Trait libraries include 28 validated morphometric descriptors (e.g., projected area asymmetry, convex hull ratio, leaf angle distribution entropy) and spectral indices derived from calibrated RGB channels (e.g., ΔGreen–Red Chromaticity, Hue Saturation Value clustering). Audit trails record operator ID, session timestamp, parameter modifications, and version-controlled algorithm settings—meeting baseline expectations for FDA 21 CFR Part 11 electronic record integrity where local validation is performed. Export options include CSV, HDF5, and annotated 3D model files compatible with MorphoGraphX, PlantSeg, or custom Python-based analysis pipelines.
Applications
This system delivers reproducible, operator-independent phenotyping for multiple research objectives: (1) Forward/reverse genetic screening—quantifying subtle morphological divergence in TILLING or CRISPR-edited lines; (2) Abiotic stress phenomics—tracking dynamic changes in canopy volume, greenness decay rate, and leaf rolling under controlled heat, salinity, drought, or cold regimes; (3) Growth kinetics modeling—fitting logistic or Gompertz functions to daily volume/height trajectories; (4) QTL mapping support—providing high-dimensional trait vectors for association studies; (5) Breeding program triage—prioritizing elite lines based on compactness × biomass trade-offs under resource-limited conditions. Its non-destructive nature permits repeated measurements on the same individual across ontogeny—critical for detecting delayed or compensatory phenotypes missed by endpoint assays.
FAQ
What plant growth stages can be reliably imaged?
Plants from cotyledon expansion through late reproductive stages are supported, provided canopy height remains below 120 cm and does not exceed turntable clearance.
Is calibration required before each experiment?
A one-time intrinsic camera calibration and lighting uniformity map are stored per unit; routine verification uses a supplied checkerboard target every 30 days or after mechanical relocation.
Can raw images and intermediate depth maps be exported?
Yes—full-resolution TIFF stacks, disparity maps, and untextured meshes are accessible via project folder navigation for third-party algorithm development.
Does the system support integration with LIMS or ELN platforms?
API endpoints (RESTful JSON over HTTPS) enable bidirectional synchronization of sample IDs, acquisition timestamps, and trait tables with commercial or in-house laboratory information systems.
What maintenance is required for long-term stability?
Annual optical alignment verification and LED panel luminance decay assessment (using integrated photodiode reference) are recommended; no consumables or recalibration fees apply.
Related Products