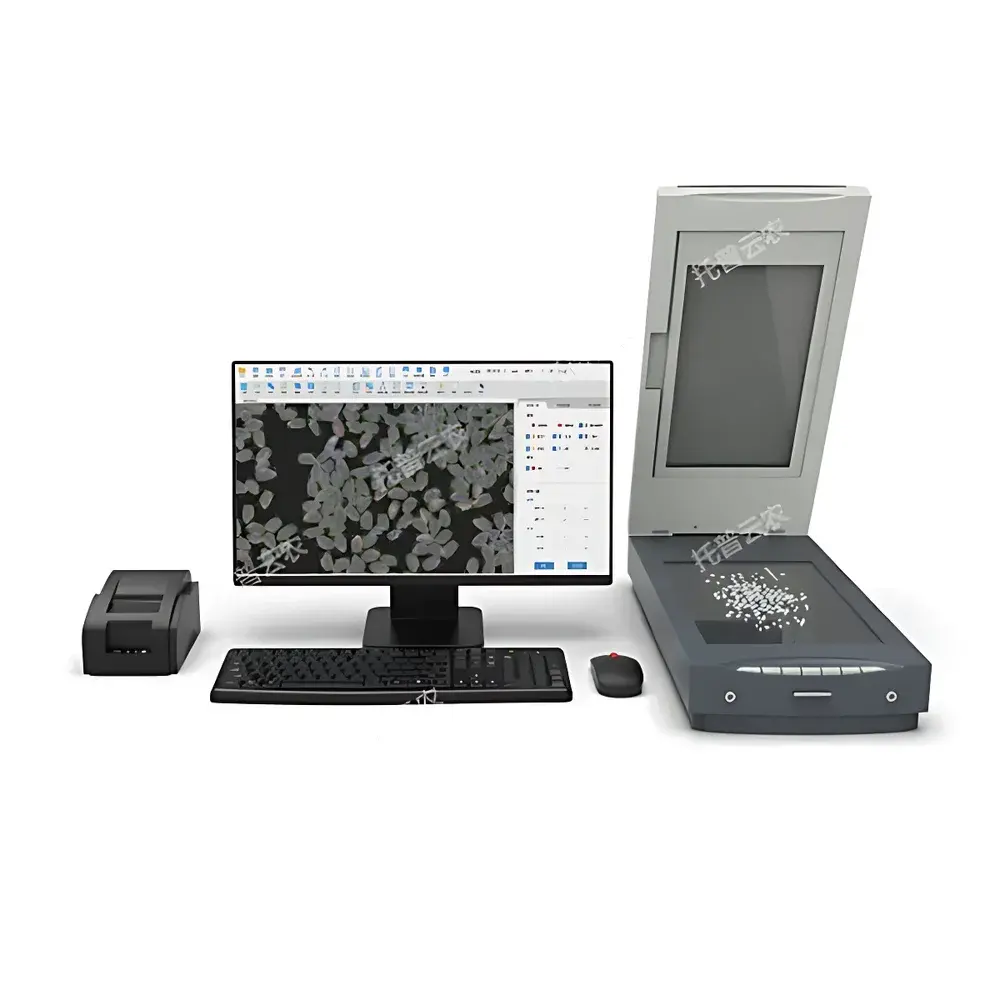
Top Cloud-agri TPMZ-A Rice Appearance Quality Analyzer
| Brand | Top Cloud-agri |
|---|---|
| Origin | Zhejiang, China |
| Manufacturer Type | Manufacturer |
| Country of Origin | Domestic (China) |
| Model | TPMZ-A |
| Pricing | Upon Request |
Overview
The Top Cloud-agri TPMZ-A Rice Appearance Quality Analyzer is a high-precision, image-based metrology system engineered for objective, standardized assessment of rice grain morphology and visual quality attributes. It operates on the principle of high-resolution transmitted-light digital imaging combined with advanced computer vision algorithms—specifically optimized for cereal grain analysis. The system captures optically enhanced grayscale and color images of rice samples laid flat on a dual-illumination scanning platform, then applies pixel-level segmentation, feature extraction, and morphometric classification to quantify physical characteristics defined in national and industry standards. Designed for traceable, repeatable analysis in regulated environments, it supports compliance-driven workflows in grain research, breeding programs, quality assurance laboratories, and food regulatory agencies.
Key Features
- Full compliance with Chinese national standards: GB/T 1350 (Paddy), GB/T 17891 (High-Quality Paddy), GB 1354 (Rice), and NY/T 2334–2013 (Rice Quality Evaluation).
- Single-grain morphometric analysis: Automated measurement of length, width, length-to-width ratio, projected area, perimeter, and circularity for each individual kernel.
- Intelligent adhesion separation: Adaptive contour detection and watershed-based splitting algorithm to resolve overlapping or touching grains without manual intervention.
- Interactive grain reclassification: On-screen click-to-assign functionality enables real-time tagging of grains as “head rice”, “broken rice”, “cracked kernels”, “yellow kernels”, “embryo-retained brown rice”, “non-glutinous rice”, or “black rice”.
- Region-of-interest (ROI) analysis: Manual polygonal or rectangular region selection allows focused quantification—e.g., calculating chalkiness rate only within a user-defined sub-area to exclude edge artifacts or foreign material.
- Visual parameter mapping: Configurable color-coded bounding boxes overlay raw images to distinguish categories (e.g., red for broken rice, green for chalky grains, blue for yellow kernels), enhancing interpretability during visual validation.
- Manual correction suite: Integrated tools for deleting impurities, misclassified grains, or dust particles; all statistical outputs update dynamically upon edit.
- Cloud-enabled data synchronization: Encrypted upload to Top Cloud-agri’s secure cloud platform (TLS 1.2+), enabling remote access, cross-laboratory comparison, and longitudinal dataset management.
- Hardware-level security: Dual-layer software protection via USB hardware key (dongle) and time-limited dynamic QR code authentication—ensuring audit-ready licensing control.
- Integrated thermal printing: Built-in compact thermal printer provides immediate hard-copy reports including sample ID, acquisition timestamp, summary metrics, and annotated thumbnail images.
Sample Compatibility & Compliance
The TPMZ-A accommodates diverse Oryza sativa cultivars—including indica, japonica, glutinous, fragrant (e.g., Ximaio), pigmented (black, yellow), organic, and specialty rice varieties—with no preprocessing required beyond standard sample leveling using the included rice-spreading tray. Its optical design ensures uniform illumination across heterogeneous grain batches, minimizing reflectance variance caused by surface texture or moisture gradients. All reported metrics—including head rice yield (%), chalky grain percentage, chalkiness degree (%), translucency index, imperfect grain count, yellow kernel ratio, varietal purity assessment, and fissure incidence—are calculated per methodologies validated against GB and NY-series standards. The system architecture supports GLP-aligned documentation: full metadata logging (operator ID, calibration timestamp, environmental conditions), immutable result archives, and exportable audit trails compliant with internal QA protocols.
Software & Data Management
The proprietary analysis software runs on Windows OS (64-bit, Windows 10/11) and features a modular GUI with tabbed workflows for acquisition, segmentation, classification, statistics, and reporting. Raw image files (TIFF, 16-bit grayscale) and processed datasets (.tpmz binary + CSV exports) are stored with embedded EXIF-like metadata. Statistical summaries include descriptive statistics (mean, SD, CV%), frequency distributions, scatter plots (e.g., length vs. width), and comparative bar charts across multiple samples. Excel (.xlsx) export preserves formula-free tabular integrity for downstream statistical analysis (e.g., ANOVA, PCA). Cloud sync includes versioned backups, role-based access control (admin/user tiers), and optional integration with LIMS via RESTful API endpoints (available under enterprise license).
Applications
- Rice breeding programs: High-throughput phenotyping of grain shape, chalkiness, and translucency for QTL mapping and marker-assisted selection.
- Grain inspection labs: Routine compliance testing for commercial rice shipments against contractual specifications or national grading criteria.
- Food safety & quality control: Monitoring post-harvest deterioration indicators (e.g., fissure development, yellowing) in storage and milling facilities.
- Academic research: Morphological correlation studies linking genotype to end-use quality traits (cooking behavior, milling yield, nutritional density).
- Regulatory enforcement: Objective evidence generation for market surveillance, certification audits (e.g., organic, geographical indication), and dispute resolution.
FAQ
What is the maximum sample weight the scanner can handle in one acquisition?
Up to 30 g of milled rice—equivalent to approximately 3,000 kernels—can be scanned in a single pass. For optimal accuracy, the recommended sample mass is 12 g.
Does the system require external calibration standards?
No routine physical calibration is needed; the scanner’s optical path is factory-characterized. Pixel-to-mm conversion is fixed via built-in reference geometry, verified during firmware initialization.
Can the software distinguish between natural chalkiness and processing-induced defects?
Yes—through multi-threshold intensity analysis and spatial texture profiling, the algorithm differentiates intrinsic chalky endosperm regions from surface abrasions or milling cracks based on grayscale homogeneity and boundary sharpness.
Is FDA 21 CFR Part 11 compliance supported?
The current version supports electronic signature capture, audit trail logging, and user-access controls. Full Part 11 readiness (including biometric authentication and sealed archive export) is available under validated configuration packages for GMP-regulated users.
What file formats can be imported for comparative analysis?
The software accepts TIFF, BMP, and PNG image files for retrospective analysis, provided they were acquired under consistent lighting and scale conditions. Batch import with metadata mapping is supported.