Wheat Panicle Counting System – TPMS-1 & TPMS-2 | Top Cloud-agri Plant Phenotyping Instrument
| Brand | Top Cloud-agri |
|---|---|
| Origin | Zhejiang, China |
| Manufacturer Type | Direct Manufacturer |
| Region of Origin | Domestic (China) |
| Models | TPMS-1, TPMS-2 |
| Pricing | Upon Request |
Overview
The Wheat Panicle Counting System (TPMS-1 and TPMS-2) is a field-deployable, image-based plant phenotyping instrument engineered for non-destructive, high-throughput quantification of wheat panicle density per mu (≈667 m²), theoretical yield estimation, grain count per unit area, and thousand-kernel weight (TKW) derivation. Leveraging computer vision algorithms grounded in convolutional neural networks (CNNs) and adaptive threshold segmentation, the system processes RGB imagery captured under natural field lighting to identify and localize individual wheat panicles with spatial context. Its operational window aligns with the physiological window of maximal panicle visibility—typically from mid-grain filling (Zadoks stage 73) through early maturity (Zadoks stage 85)—when spike morphology is stable and background interference (e.g., leaf occlusion, lodging) is minimized. Designed for integration into breeding pipelines, agronomic trials, and germplasm evaluation programs, the TPMS series supports objective, operator-independent phenotypic data acquisition compliant with FAO-recommended wheat growth staging protocols and ISO 20679 (Plant Phenomics — Terminology and Data Exchange Standards).
Key Features
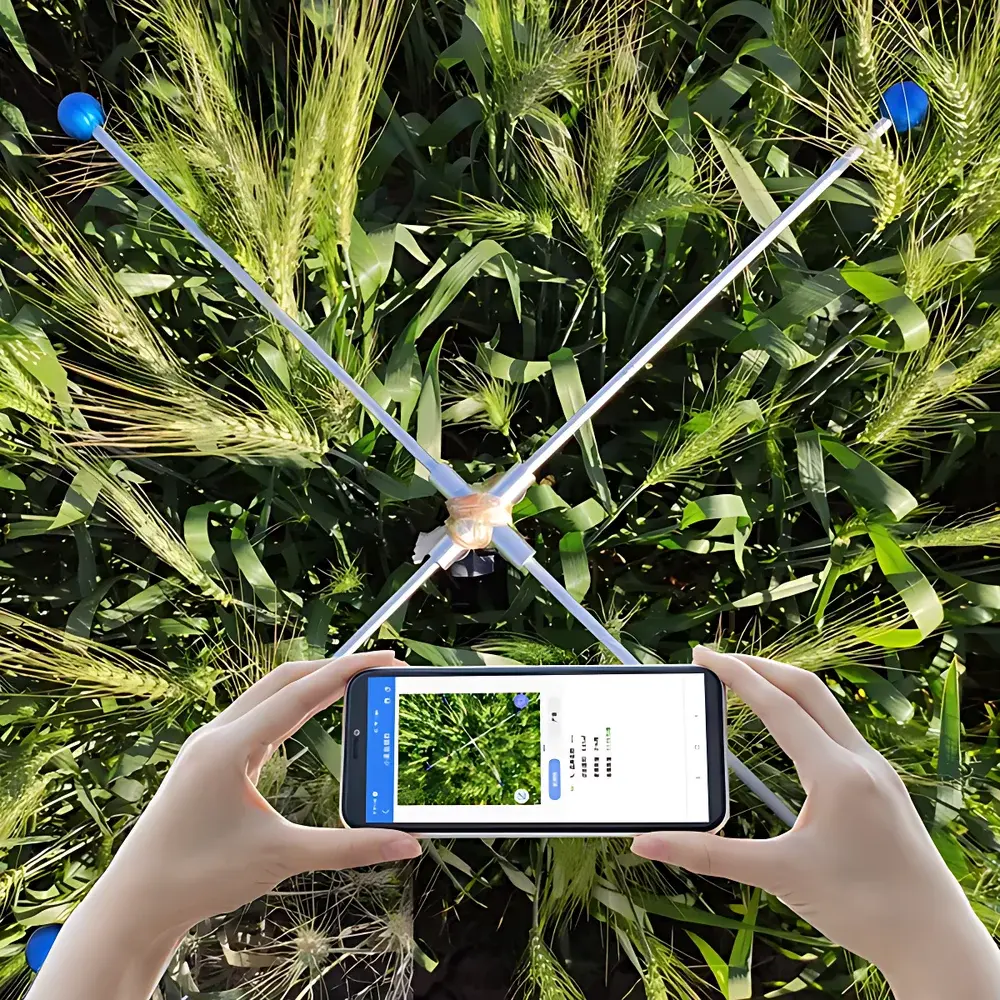
- Two calibrated field reference standards: cross-shaped calibrator (0.25 m² effective area, height-adjustable 750–1600 mm) and square calibrator (0.5 m², fixed 707 × 707 mm), enabling dual-method validation and error cross-checking.
- Augmented Reality (AR)-assisted imaging: integrated AR glasses paired with Bluetooth monopod enable real-time framing guidance, horizon alignment, and optimal standoff distance control—critical for tall-canopy or lodged wheat stands.
- Batch processing capability: concurrent analysis of up to 48 geotagged images per session; supports deferred processing with timestamped metadata retention.
- Smart perspective correction: automatic lens distortion compensation and affine transformation based on detected calibrator geometry—ensuring pixel-to-area fidelity across heterogeneous smartphone models (iOS/Android).
- Interactive manual refinement: touch-enabled pixel-level correction interface guarantees 100% counting accuracy where automated detection encounters partial occlusion or morphological ambiguity.
- Integrated TKW calculation module: accepts user-input grain mass (g) and auto-computes thousand-kernel weight using detected grain count within the calibrated frame.
- On-device analytics: Android-native application enables live capture, real-time panicle localization, horizontal plane verification, voice-assisted result readout, and watermark-embedded image export.
Sample Compatibility & Compliance
The TPMS platform is validated for Triticum aestivum L. cultivars grown under conventional, high-density, and dwarf-type management systems. It accommodates variable planting densities (150–600 spikes/m²), canopy heights (60–120 cm), and environmental conditions including partial cloud cover and moderate wind-induced motion blur. Calibration components meet ISO 9001-certified dimensional tolerances (±1.5 mm). Data output conforms to MIAPPE v1.1 (Minimum Information About a Plant Phenotyping Experiment) metadata schema. All software modules comply with GLP-aligned audit trail requirements—including immutable timestamps, operator ID logging, and version-controlled algorithm parameters—supporting traceability in regulatory submissions (e.g., OECD Seed Certification, USDA APHIS varietal release documentation).
Software & Data Management
TPMS-1 operates exclusively via Android mobile application with offline inference capability. TPMS-2 extends functionality with desktop-grade Windows/macOS software featuring cloud synchronization (Top Cloud-agri secure SaaS platform), multi-user role-based access control, and RESTful API integration for LIMS or Breeding Management Systems (BMS). Analytical outputs include: panicle count per mu, panicle density (m⁻²), estimated grain number per unit area, coefficient of variation (CV%) across replicates, and TKW (g/1000 seeds). Export formats include .xlsx (with formula-locked cells), .csv (UTF-8 encoded), and .pdf summary reports containing embedded geo-referenced thumbnails and calibration verification logs. All data modifications are logged with before/after values and operator signature.
Applications
- High-throughput screening of elite wheat lines in national variety trials (e.g., China National Wheat Regional Trials, CIMMYT Elite Yield Trials).
- QTL mapping and GWAS studies requiring precise panicle architecture phenotypes as quantitative traits.
- Optimization of nitrogen application timing and seeding rate through longitudinal panicle density monitoring.
- Validation of remote sensing-derived vegetation indices (e.g., NDVI, GNDVI) against ground-truthed panicle counts.
- Training datasets generation for transfer learning in cross-species panicle detection (e.g., barley, rye, triticale).
- Extension service support for precision yield forecasting at county-level agricultural bureaus.
FAQ
What growth stage is optimal for data collection?
Data acquisition is recommended between Zadoks growth stages 73 (mid-grain filling) and 85 (early maturity), when panicles are fully emerged, non-lodged, and exhibit minimal glume closure or awn overlap.
Does the system require internet connectivity during field measurement?
No—TPMS-1 and TPMS-2 both support fully offline image capture and on-device inference. Cloud sync and advanced reporting require post-field Wi-Fi or cellular upload.
Can the system distinguish between fertile and sterile tillers?
Current firmware identifies morphologically distinct panicles but does not classify fertility status. Integration with thermal or multispectral add-ons is under development for future firmware release.
Is calibration required before each use?
Yes—cross or square calibrator must be deployed in-frame prior to every image set to anchor pixel-to-area conversion and compensate for device-specific focal length variance.
How is measurement uncertainty quantified?
Systematic error is bounded at ±5% relative standard deviation (RSD) under controlled field validation (n ≥ 120 plots, three operators, two cultivars), per internal verification report TR-TPMS-2023-04 compliant with ISO/IEC 17025 clause 7.6.
Related Products


