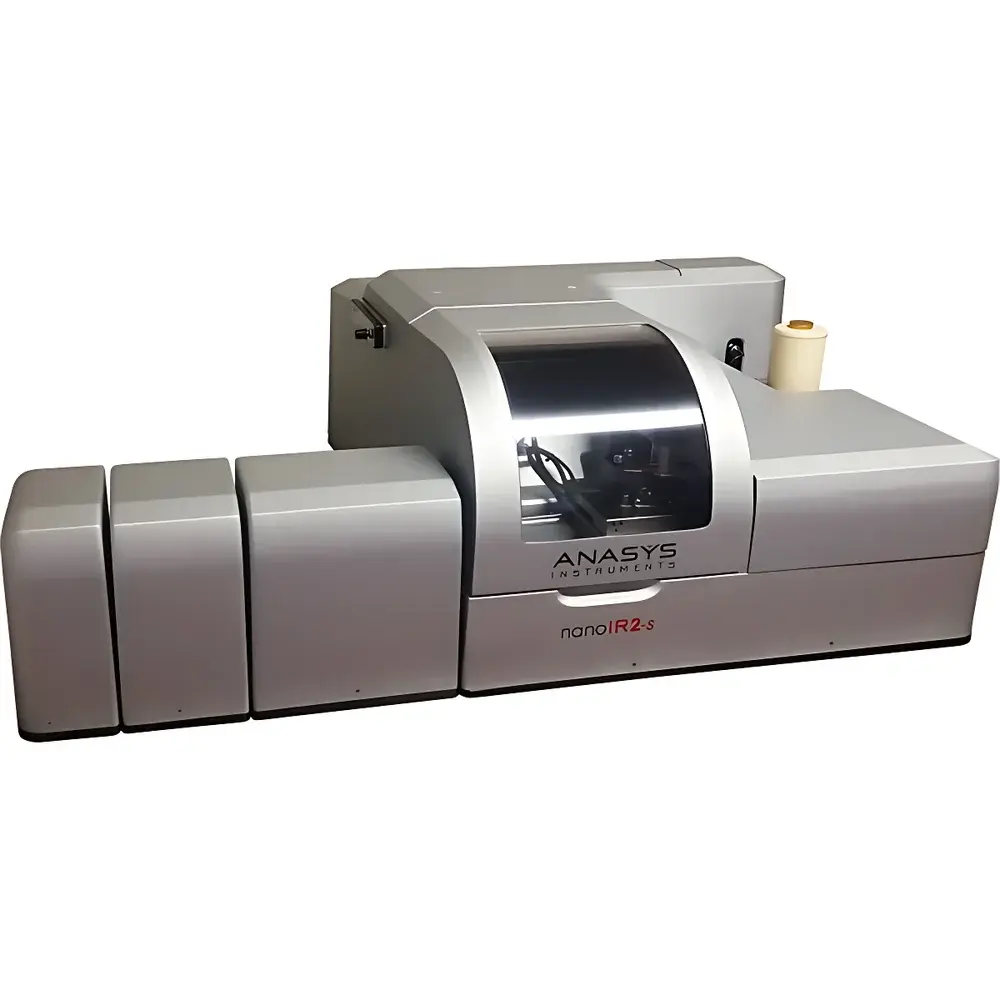
Bruker oIR3-s Nano-FTIR and Scattering-type Scanning Near-Field Optical Microscopy (s-SNOM) System
| Brand | Bruker |
|---|---|
| Origin | USA |
| Manufacturer Type | Authorized Distributor |
| Origin Category | Imported |
| Model | oIR3-s |
| Instrument Type | Laboratory-Based Fourier Transform Infrared Spectrometer |
| Wavenumber Range | 900–3600 cm⁻¹ |
| Spatial Resolution | <10 nm |
| Spectral Resolution | <1 cm⁻¹ |
| Acquisition Speed | 10 s per spectrum |
| Signal-to-Noise Ratio | 200:1 |
Overview
The Bruker oIR3-s is a state-of-the-art hybrid nanoscale infrared spectroscopy and scattering-type scanning near-field optical microscopy (s-SNOM) platform engineered for correlative chemical, structural, and functional characterization at true nanometer-scale spatial resolution. Built upon Bruker’s industry-leading Dimension™ AFM architecture, the oIR3-s integrates two complementary near-field techniques—AFM-IR (photothermal induced resonance) and s-SNOM—within a single, fully synchronized instrument. AFM-IR operates on the principle of localized photothermal expansion: pulsed tunable IR radiation excites molecular vibrations in the sample; the resulting nanoscale thermal expansion is detected via AFM cantilever resonance, yielding absorption spectra that are quantitatively aligned with bulk FTIR reference data—no peak shifts or calibration artifacts. s-SNOM, in contrast, relies on coherent scattering of mid-IR light from a metallized AFM tip under interferometric homodyne/heterodyne detection, enabling label-free, phase-resolved optical imaging governed by the tip apex radius (<10 nm), independent of diffraction limits. This dual-modal capability provides orthogonal validation: AFM-IR delivers quantitative vibrational spectroscopy with chemical specificity, while s-SNOM delivers amplitude/phase maps of optical polarizability, plasmonic response, and dielectric contrast.
Key Features
- Sub-10 nm spatial resolution for both infrared spectroscopy and optical imaging—enabled by monolithic AFM-IR + s-SNOM co-localization on a vibration-isolated, ultra-stable platform
- Full spectral coverage from 900 to 3600 cm⁻¹ with <1 cm⁻¹ spectral resolution, compatible with standard FTIR databases (e.g., SDBS, NIST) for unambiguous peak assignment
- Automated, patent-protected optical path alignment system minimizing setup time and eliminating manual realignment between experiments
- Integrated high-performance quantum cascade laser (QCL) source and liquid-nitrogen-cooled MCT detector for optimal signal-to-noise ratio (200:1)
- Real-time acquisition at 10 seconds per full spectrum, supporting rapid hyperspectral mapping over user-defined regions of interest
- Native compatibility with Bruker’s Dimension Icon AFM base, enabling simultaneous or sequential nanomechanical, nanothermal (oTA/SThM), nanoelectrical (CAFM, KPFM, EFM), and nanomagnetic (MFM) measurements
Sample Compatibility & Compliance
The oIR3-s accommodates a broad range of solid-state samples without vacuum requirements or conductive coating: thin films, 2D materials (e.g., graphene, hBN), polymer blends, organic-inorganic hybrids, biological membranes, semiconductor heterostructures, plasmonic nanoantennas, and battery electrode cross-sections. Sample preparation follows standard AFM protocols—flatness <5 nm RMS over 10 × 10 µm² is recommended for optimal near-field coupling. The system complies with ISO/IEC 17025 calibration traceability requirements for analytical instrumentation and supports audit-ready operation under GLP and GMP frameworks. Data acquisition logs include timestamped metadata (laser power, modulation frequency, tip condition, environmental temperature/humidity), satisfying FDA 21 CFR Part 11 electronic record integrity criteria when deployed with Bruker’s compliant software configuration.
Software & Data Management
Control and analysis are executed through Bruker’s proprietary NanoIR Software Suite, built on a modular, Python-extendable architecture. The interface provides real-time spectral preview, automated baseline correction, multivariate curve resolution (MCR), and point-and-click spectral library matching against >12,000 reference compounds. Hyperspectral datasets (up to 1024 × 1024 pixels × 512 wavenumbers) are stored in HDF5 format with embedded MIAME-compliant metadata. Export options include ASCII, CSV, and standardized JCAMP-DX for interoperability with third-party chemometrics tools (e.g., MATLAB, Unscrambler X, Python scikit-learn). All processing steps—including FFT filtering, phase retrieval, and dielectric function inversion—are scriptable and reproducible, ensuring full method traceability across laboratories.
Applications
- Mapping chemical heterogeneity in polymer nanocomposites—resolving filler-matrix interfaces, phase separation domains, and degradation fronts at <10 nm scale
- Characterizing phonon-polariton dispersion in van der Waals crystals and plasmon damping mechanisms in doped graphene nanostructures
- Validating molecular orientation and crystallinity gradients in organic photovoltaic active layers
- Identifying trace contaminants and interfacial reaction products in semiconductor gate stacks and MEMS packaging layers
- Correlating local mechanical modulus (via AM-FM) with chemical composition (via AFM-IR) in amyloid fibrils and lipid bilayers
- Quantifying carrier concentration and mobility profiles in 2D transistor channels using s-SNOM phase contrast
FAQ
How does AFM-IR spectral fidelity compare to conventional FTIR?
AFM-IR spectra exhibit direct wavenumber correspondence with transmission/reflection FTIR references—no systematic peak shifts occur because photothermal detection measures intrinsic vibrational absorption, not scattered intensity.
Can s-SNOM resolve optical phase information?
Yes—interferometric detection enables simultaneous acquisition of near-field amplitude and phase, critical for distinguishing plasmonic resonances from dielectric background.
Is vacuum operation required?
No—the system operates under ambient air or controlled purge gas (N₂, dry air); optional environmental chamber supports temperature-controlled measurements from −10 °C to 80 °C.
What AFM modes are natively supported alongside oIR3-s?
All Bruker Dimension Icon capabilities: contact/resonance-enhanced AFM, PeakForce Tapping®, ScanAsyst®, electrochemical AFM (EC-AFM), and all listed nanoscale property modules (oTA, LCR, CAFM, KPFM, MFM, EFM).
Does the system support quantitative dielectric modeling?
Yes—near-field amplitude and phase data can be inverted using established analytic models (e.g., dipole approximation, finite-element simulations) to extract local ε(ω) and σ(ω) values.