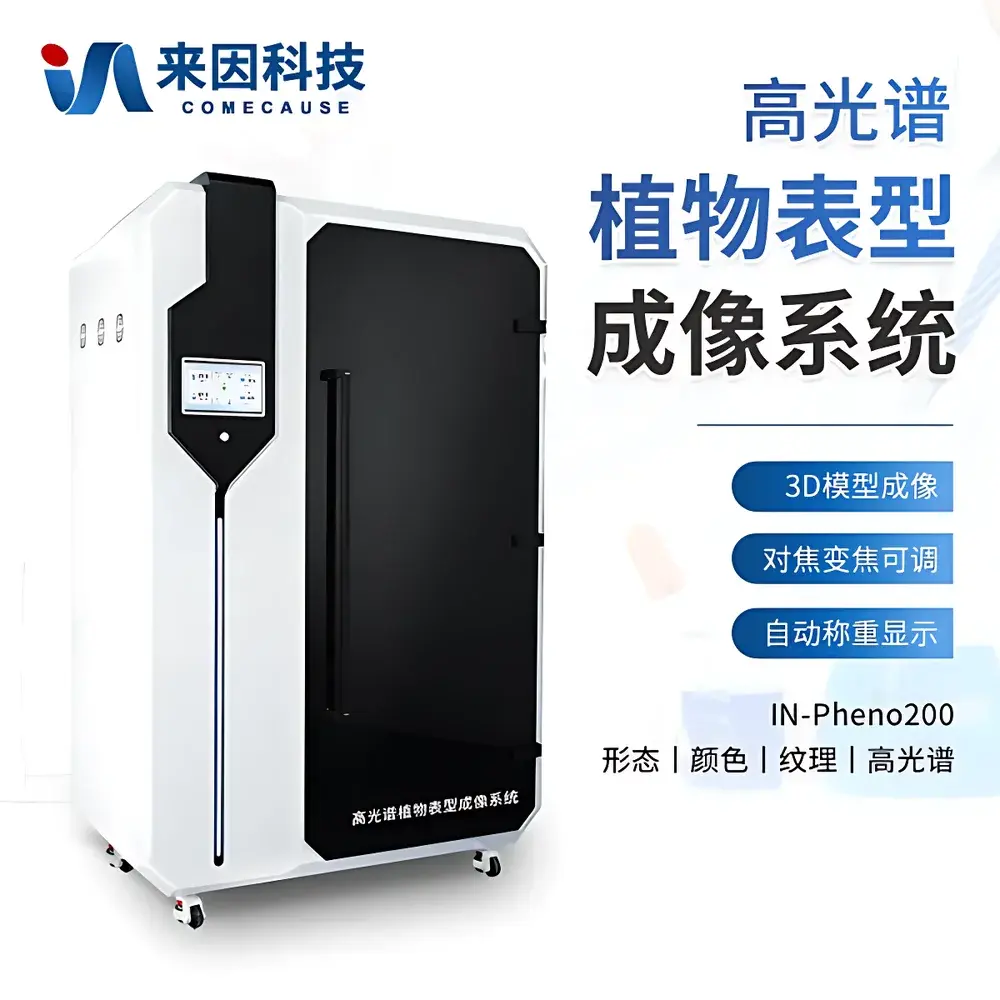
COMECAUSE IN/Pheno200 High-Spectral 3D Plant Phenotyping Imaging System
| Brand | COMECAUSE |
|---|---|
| Origin | Shandong, China |
| Manufacturer Type | Direct Manufacturer |
| Regional Category | Domestic (China) |
| Model | IN/Pheno200 |
| Price | USD 77,000 (FOB Qingdao) |
| Optical Resolution | Up to 12 MP |
| Plant Height Range | 300–1000 mm |
| Plant Width Range | 100–500 mm |
| Fresh Weight Capacity | 100–75,000 g |
| Enclosure Dimensions | 1400 × 830 × 2140 mm (L×W×H) |
| Spectral Range | 400–1000 nm (VIS-NIR), 256 contiguous bands |
| Acquisition Time per Plant | ≤40 s |
| 3D Reconstruction Time | ≤30 s |
| Environmental Sensors | Integrated temperature & humidity monitoring (±0.3 °C, ±2% RH) |
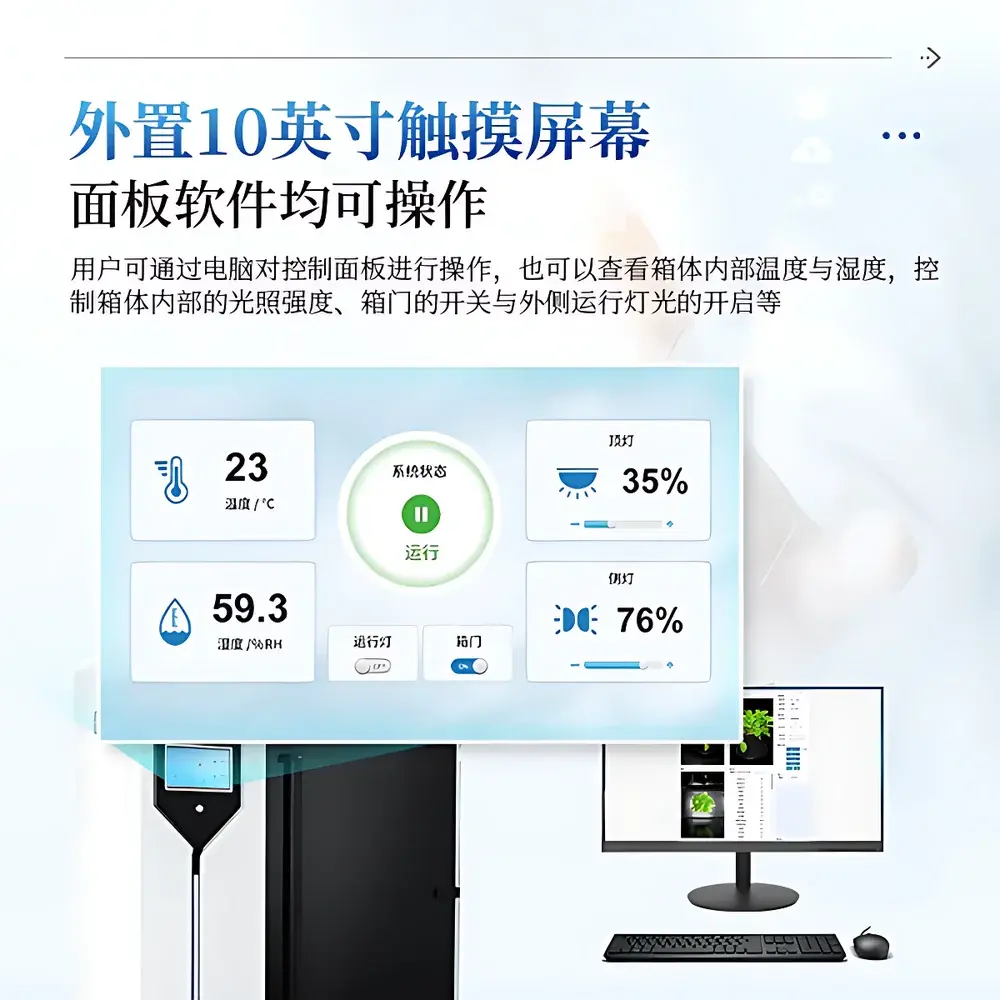
| Control Interface | 10-inch industrial touchscreen + Windows-based desktop software (Windows 10/11, Intel i5+, 8 GB RAM, NVIDIA GPU ≥8 GB VRAM) |
| Data Export Formats | .spe, .json (analysis_result.json), .ply (3D mesh), .mp4 (3D model animation), CSV (morphological/color/texture metrics) |
| Compliance | Designed for GLP-aligned lab workflows |
Overview
The COMECAUSE IN/Pheno200 is a fully integrated, non-destructive high-spectral 3D plant phenotyping imaging system engineered for quantitative, multi-modal characterization of plant structure, physiology, and biochemistry under controlled environments. It operates on the principle of hyperspectral reflectance imaging—capturing spatially resolved spectral signatures across 256 narrow, contiguous bands from 400 to 1000 nm—combined with multi-angle visible-light photogrammetry to reconstruct true 3D surface geometry. Unlike RGB-only or discrete-band multispectral systems, the IN/Pheno200 delivers continuous spectral data at pixel-level resolution, enabling detection of subtle biochemical shifts—such as chlorophyll a/b ratio, anthocyanin accumulation, water content gradients, and early-stage biotic/abiotic stress markers—without tissue sampling. Its modular optical architecture includes top-, side-top-, and side-bottom-mounted imaging units synchronized with a precision motorized turntable, ensuring complete circumferential coverage of intact plants up to 1 m in height. The system is calibrated traceably to NIST-traceable standards and designed to support reproducible, longitudinal phenotyping studies compliant with FAO/CGIAR phenotyping guidelines and ISO 20671-1:2021 (Plant phenotyping—Terminology and general principles).
Key Features
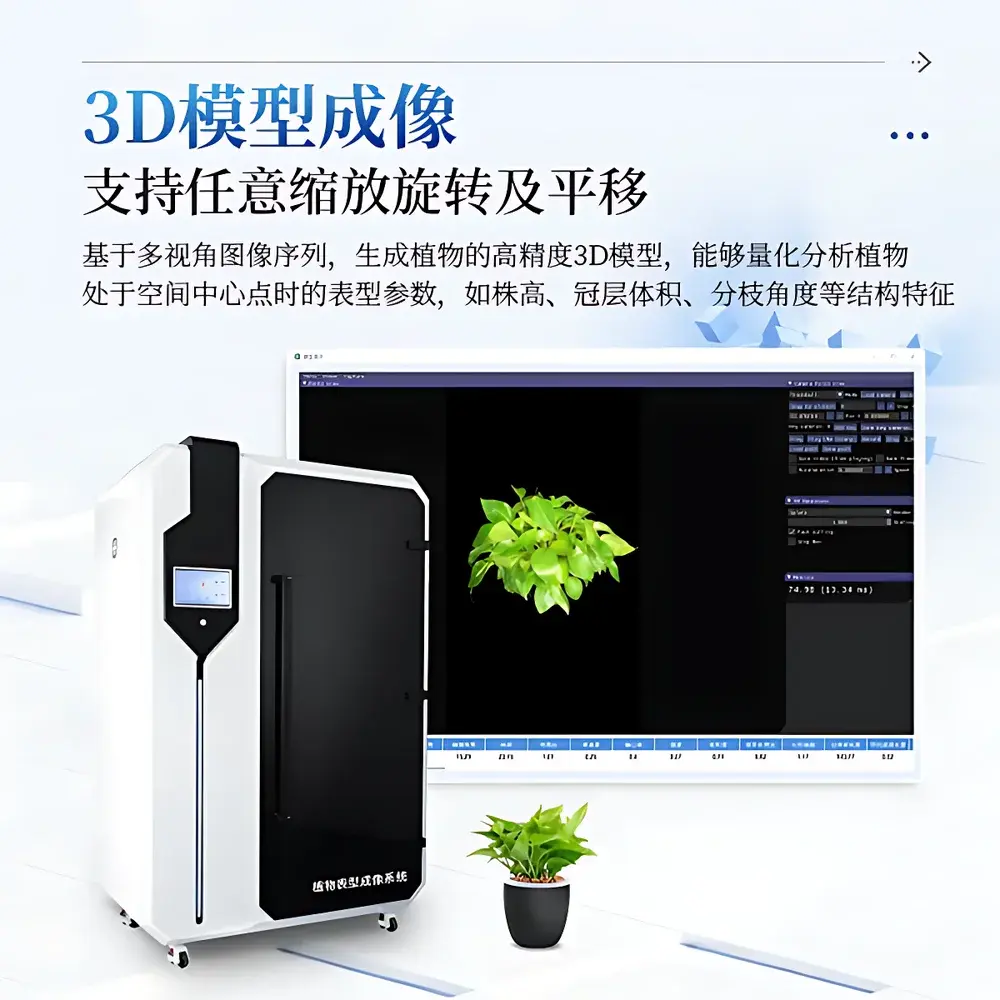
- Multi-view 3D photogrammetric reconstruction: Generates geometrically accurate, textured 3D point clouds and mesh models using computer vision algorithms (structure-from-motion + multi-view stereo), supporting arbitrary rotation, zoom, and sectioning in native 3D space.
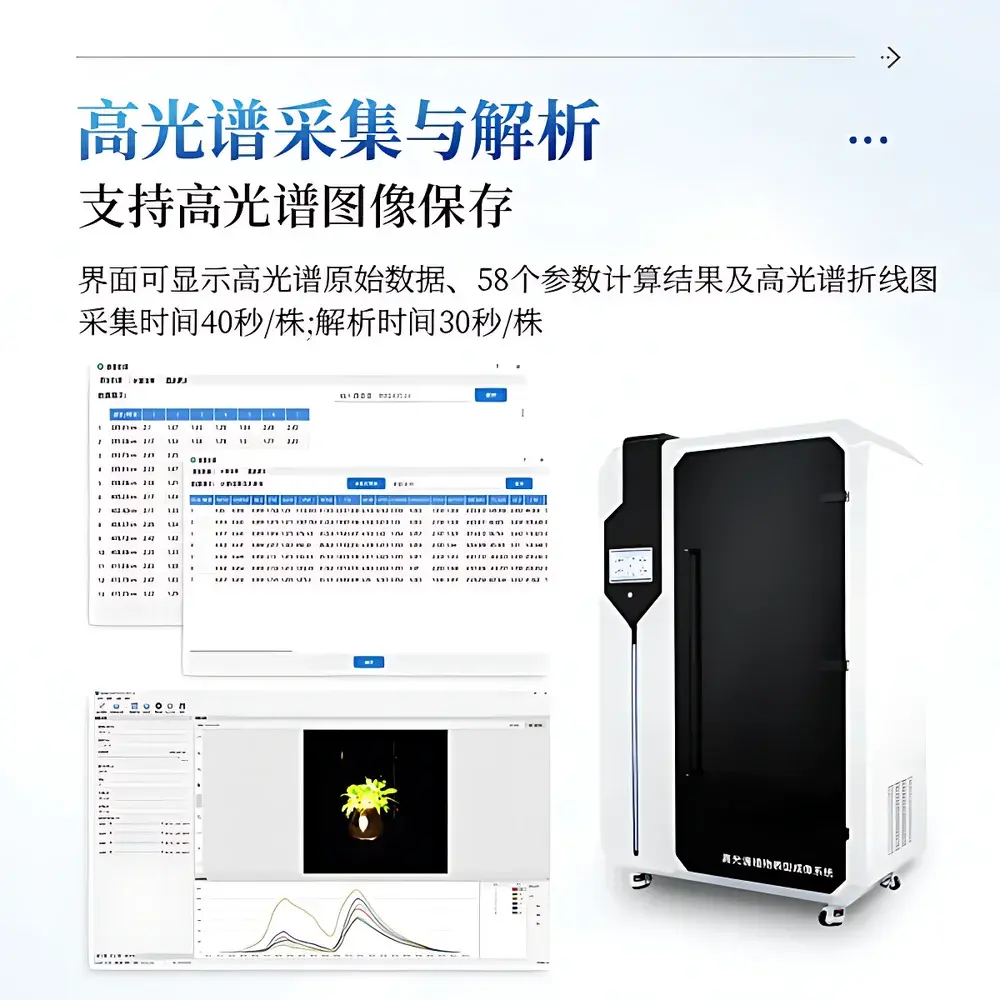
- Hyperspectral acquisition & analysis pipeline: Pre-calibrated VIS-NIR camera captures full spectral cubes (x, y, λ); onboard processing computes 58 standardized vegetation indices (e.g., NDVI, PRI, MCARI, SIPI) and exports raw .spe files alongside JSON-structured analysis results.
- Automated adaptive imaging: Real-time size assessment triggers dynamic adjustment of lens height, illumination intensity, and image stitching logic—enabling seamless handling of heterogeneous canopy architectures from seedlings to mature cereal or legume plants.
- Integrated environmental monitoring: Onboard temperature and humidity sensors log ambient conditions during acquisition, ensuring metadata integrity for environmental covariate modeling in statistical analyses.
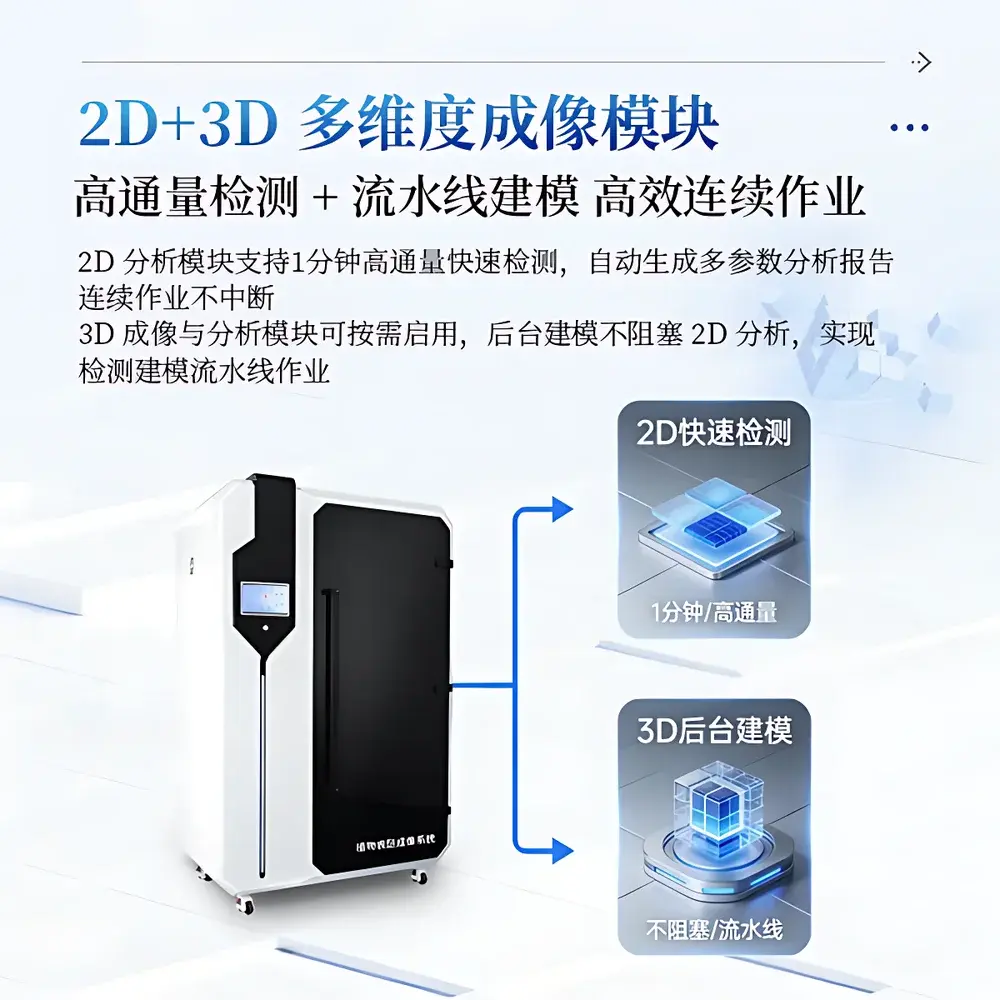
- Parallel 2D/3D workflow engine: 2D morphometric analysis completes in <60 s per plant; 3D reconstruction runs asynchronously in background queue—no interruption to high-throughput 2D screening.
- Fully traceable data provenance: Each dataset embeds timestamps, operator ID (via login), instrument configuration, calibration status, and environmental readings—supporting 21 CFR Part 11–compliant audit trails when deployed in regulated breeding or preclinical agri-biotech applications.
Sample Compatibility & Compliance
The IN/Pheno200 accommodates a broad taxonomic range including Poaceae (e.g., rice, wheat, maize), Solanaceae (tomato, pepper), Brassicaceae (Arabidopsis, canola), and Fabaceae (soybean, pea). Plants must fit within the specified dimensional envelope (300–1000 mm height; 100–500 mm width) and weigh between 100 g and 75 kg. The system is validated for use with potted specimens grown in standard 10–20 cm diameter containers. All optical components meet IEC 61000-6-3 EMC emission limits and IP54-rated enclosure design ensures dust/moisture resistance during routine lab operation. While not certified for GMP manufacturing, its architecture aligns with GLP documentation requirements—including immutable metadata logging, user-access controls, and versioned software updates—and supports integration into ISO/IEC 17025-accredited testing laboratories conducting phenotypic trait validation.
Software & Data Management
The proprietary Phenolink™ software suite (v4.2+) runs natively on Windows 10/11 and provides unified control of imaging, environmental subsystems, and analytics. Key modules include: (1) Adaptive Capture Manager for auto-framing and mosaic stitching; (2) 2D Morphometrics Engine computing 42 shape descriptors (e.g., fractal dimension, convex hull perimeter ratio, skeleton branch angle distribution); (3) Color Space Analyzer calculating CIELAB (D65/2°), HSV, and grayscale statistics separately for top- and side-view projections; (4) Gray-Level Co-occurrence Matrix (GLCM)-based Texture Quantifier deriving 12 texture features (ASM, contrast, homogeneity, entropy, etc.) per ROI; (5) Hyperspectral Explorer with interactive spectral library matching and ROI-based spectral averaging; (6) Cloud Sync Agent for encrypted upload to secure AWS-hosted repositories via device-unique UUID binding. All outputs comply with MIAPPE 1.1 metadata standards and export to FAIR-compliant formats (CSV, JSON-LD, PLY, MP4).
Applications
The IN/Pheno200 serves core research and development functions across academic, public-sector, and industrial plant science domains. In functional genomics, it enables high-resolution mapping of QTLs associated with drought resilience by correlating canopy temperature gradients (derived from thermal band proxies), stomatal conductance proxies (from red-edge slope), and structural plasticity metrics (e.g., leaf angle distribution entropy). In breeding programs, it accelerates selection cycles by quantifying nitrogen use efficiency via chlorophyll index stability across growth stages, or identifying disease resistance through early spectral deviations in the 550–650 nm region preceding visual symptom onset. Ecophysiology studies leverage its capacity to resolve intra-canopy light interception heterogeneity—quantified via 3D voxelized transmittance modeling—to parameterize radiative transfer simulations. Additionally, it supports regulatory submissions requiring objective phenotypic evidence, such as OECD consensus documents on environmental risk assessment of genetically engineered plants.
FAQ
What spectral resolution and range does the hyperspectral camera provide?
The system uses a push-broom imager with 256 contiguous bands spanning 400–1000 nm, with spectral sampling interval ≤2.35 nm and FWHM ≤5 nm.
Is the 3D model output compatible with third-party simulation tools?
Yes—exports in standard PLY format with vertex-normal and UV-mapped texture coordinates, directly importable into MATLAB, Blender, or CropSyst for biomechanical or radiative transfer modeling.
How is calibration maintained over time?
Factory calibration includes white reference tile (Spectralon® 99%) and dark current correction; users perform daily quick-check using built-in reference patches, with full recalibration recommended every 6 months or after optical reconfiguration.
Can the system operate unattended for overnight phenotyping runs?
Yes—the software supports scheduled batch acquisition with automatic error recovery, email alerts on failure, and watchdog-triggered shutdown if environmental thresholds are breached.
Does the system meet any international phenotyping data standards?
It complies with MIAPPE 1.1 for metadata completeness and supports BrAPI v2.0 endpoints for integration with BreedBase and other breeding informatics platforms.