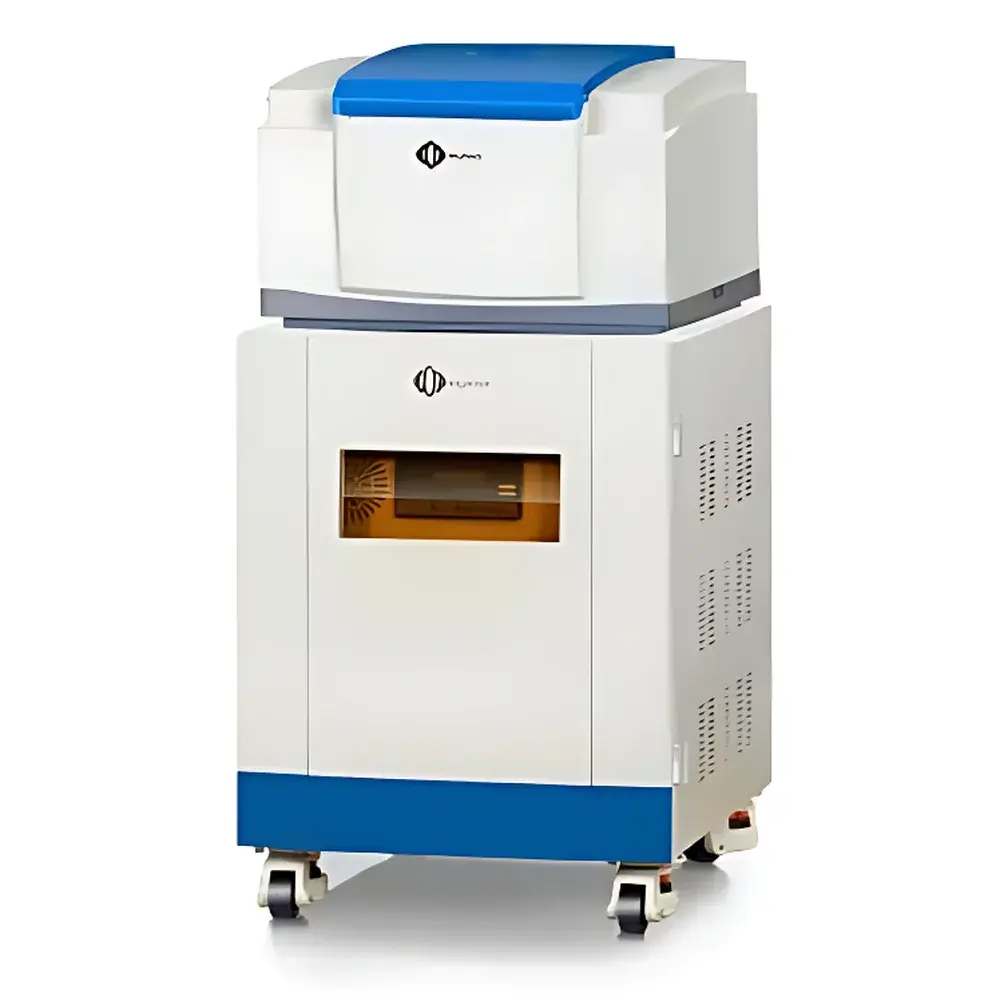
NIUMAG PQ001-kl Particle Dispersion and Stability Analyzer
| Brand | NIUMAG |
|---|---|
| Origin | Jiangsu, China |
| Manufacturer Type | Authorized Distributor |
| Product Category | Domestic Instrument |
| Model | PQ001-kl |
| Instrument Type | Particle Characterization Analyzer |
| Measurable Powder Parameters | Dispersion Index (DI), Stability Index (SI), Relative Surface Affinity |
| Maximum Sample Cell Capacity | 2 mL |
| Measurement Principle | Dynamic Light Scattering (DLS) coupled with Time-Resolved Turbidity Analysis (TRTA) |
| Software Platform | NIUMAG DispersionSuite v3.2 (GLP-compliant audit trail, user-level access control, data export in CSV/PDF/XLSX) |
Overview
The NIUMAG PQ001-kl Particle Dispersion and Stability Analyzer is a benchtop instrument engineered for quantitative assessment of colloidal and suspension stability in concentrated particulate systems. It operates on the dual-principle foundation of dynamic light scattering (DLS) for real-time particle size distribution tracking and time-resolved turbidity analysis (TRTA) for macroscopic phase separation kinetics. Unlike conventional sedimentation analyzers or static zeta potential meters, the PQ001-kl captures both nanoscale dispersion behavior (via Brownian motion analysis) and micrometer-scale aggregation/creaming dynamics (via optical transmission decay profiling) within a single 2 mL sample cell. Its measurement architecture is optimized for non-diluted, high-solid-content dispersions—ranging from ceramic slurries (≥40 vol%) to battery cathode slurries (≤65% solids), inkjet inks, CMP slurries, and pharmaceutical nanosuspensions. The system delivers three primary outputs: Dispersion Index (DI), quantifying the degree of de-agglomeration relative to a reference baseline; Stability Index (SI), calculated from the slope of normalized transmittance vs. time curves over defined intervals (0–60 min); and Relative Surface Affinity (RSA), derived from comparative DI shifts under varying dispersant concentrations or pH conditions.
Key Features
- Integrated dual-optical path detection: 650 nm laser source for DLS + 850 nm LED array for TRTA, enabling simultaneous nano- and micro-scale monitoring without sample reconfiguration
- Temperature-controlled sample chamber (20–40 °C, ±0.3 °C) to assess thermal stability and accelerate aging studies per ISO 13321 and ASTM D7826 protocols
- Automated dispersion protocol library with programmable agitation sequences (vortex, orbital shaking, ultrasonic pulse) synchronized with real-time optical acquisition
- Self-calibrating optical train with NIST-traceable reference standards for turbidity linearity (0–100% T) and particle sizing accuracy (±3% RSD for monodisperse latex standards)
- Ruggedized aluminum alloy chassis with EMI-shielded electronics enclosure, compliant with IEC 61326-1 for laboratory electromagnetic compatibility
Sample Compatibility & Compliance
The PQ001-kl accepts opaque, viscous, and optically heterogeneous suspensions—including graphite nanoplatelet dispersions, LiFePO₄ cathode slurries, TiO₂ pigment pastes, and polymeric nanofiber gels—without dilution or centrifugation. Its 2 mL quartz cuvette supports direct loading of shear-thinned or thixotropic media, with integrated magnetic stirrer for homogenization during measurement. The instrument meets essential regulatory requirements for quality-controlled environments: software architecture supports 21 CFR Part 11-compliant electronic signatures, full audit trail logging (user actions, parameter changes, result exports), and role-based access control (Administrator, Analyst, Reviewer). All raw data files are stored in encrypted HDF5 format with embedded metadata (timestamp, operator ID, instrument serial, calibration status), satisfying GLP/GMP documentation standards for QC labs in pharmaceutical, battery, and advanced materials manufacturing.
Software & Data Management
NIUMAG DispersionSuite v3.2 provides a unified interface for method development, acquisition, and reporting. The software features a modular workflow: Method Editor (defining temperature ramping, agitation profiles, and acquisition intervals), Real-Time Dashboard (overlaying DLS-derived hydrodynamic diameter trends with TRTA-derived stability decay curves), and Comparative Analysis Module (statistical evaluation across batches using ANOVA or Mann–Whitney U tests). Reports generate automatically in PDF or XLSX formats, including annotated graphs, summary tables (mean DI/SI ± SD), and pass/fail flags against user-defined specification limits. Raw data archives support retrospective reprocessing with updated algorithms—ensuring long-term data integrity without retesting.
Applications
- Ceramics: Optimization of wet-milling parameters and binder selection for alumina/zirconia slurries; monitoring dispersion stability during slip casting and tape-casting processes
- Battery Materials: Quantifying carbon black agglomerate breakdown in NMP-based cathode slurries; evaluating surfactant efficacy on SiO₂-coated NCM811 particles
- Electronics: Stability benchmarking of Cu/CeO₂ CMP slurries under varying pH and oxidizer concentrations; correlating DI with post-CMP wafer defect density
- Pharmaceuticals: Assessing wetting kinetics and surface hydration of amorphous solid dispersions; screening excipient compatibility for nanoparticle-based oral formulations
- Ink Development: Mapping pigment dispersion energy thresholds for carbon black in aqueous acrylic resins; linking RSA values to jetting reliability in industrial inkjet printing
FAQ
What sample volume is required for a standard PQ001-kl measurement?
A minimum of 1.5 mL and a maximum of 2.0 mL of undiluted suspension is required to fill the standardized quartz cuvette and ensure optical path consistency.
Can the PQ001-kl measure zeta potential?
No. The PQ001-kl does not incorporate electrophoretic light scattering (ELS); it focuses exclusively on dispersion state and physical stability via optical means. Zeta potential requires complementary instrumentation.
Is method validation supported per ICH Q2(R2)?
Yes. The system includes built-in repeatability (n=6), intermediate precision (inter-day, inter-operator), and robustness testing modules aligned with ICH Q2(R2) guidance for analytical procedure validation.
How is data integrity ensured during software updates?
All historical datasets remain fully accessible and unaltered after firmware or software upgrades. New processing algorithms operate in parallel mode, allowing side-by-side comparison between legacy and updated results without data migration.
Does the instrument require external calibration standards for routine operation?
No. The optical system performs automatic self-calibration at startup using internal reference channels. Certified polystyrene latex standards (e.g., 100 nm, 500 nm) are recommended annually for performance verification per ISO/IEC 17025.


