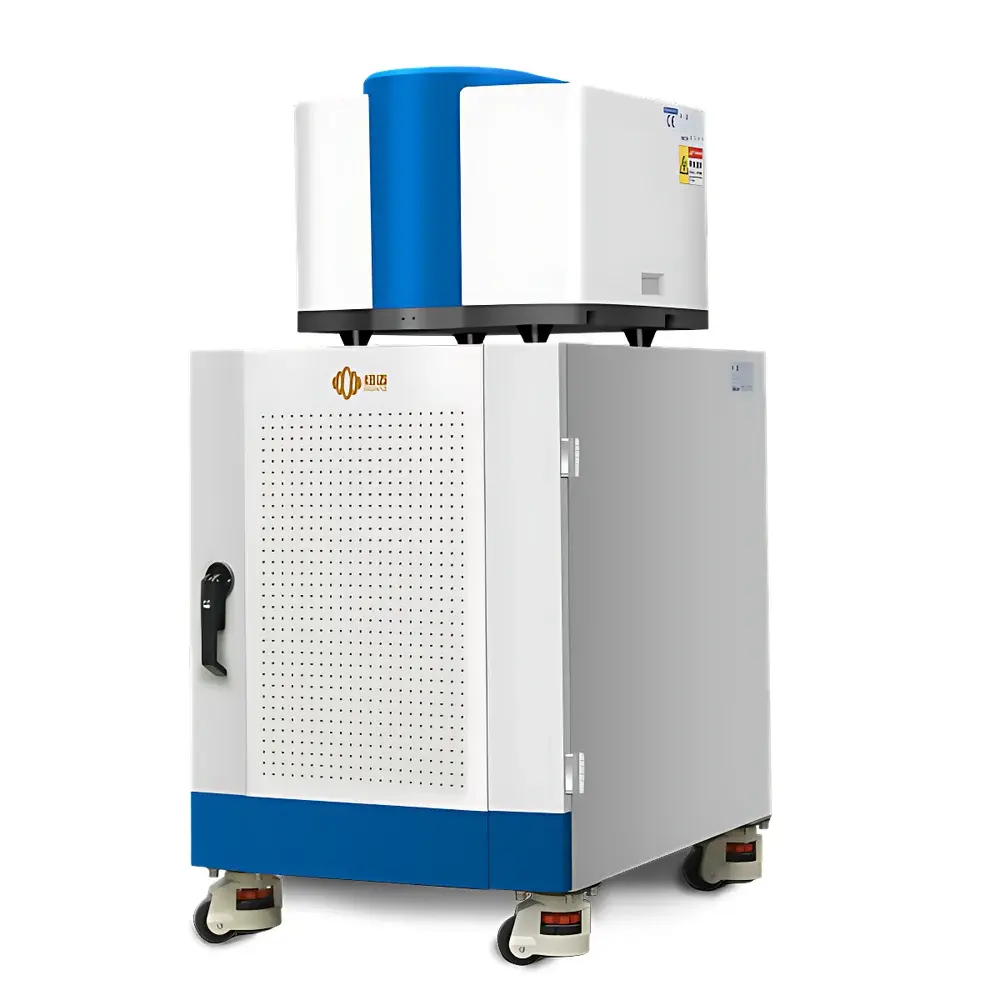

NIUMAG PQ001-12 Solid-State Electrolyte Dispersion Analyzer (Low-Field NMR Spectrometer)
| Brand | NIUMAG |
|---|---|
| Origin | Jiangsu, China |
| Manufacturer Type | Authorized Distributor |
| Origin Category | Domestic |
| Model | PQ001-12 |
| Instrument Type | Low-Field Nuclear Magnetic Resonance (LF-NMR) Spectrometer |
| Sample Type | Solid-Liquid Composite Materials |
| Magnet Type | Permanent Magnet |
| Magnetic Field Strength | 0.5 T ± 0.03 T |
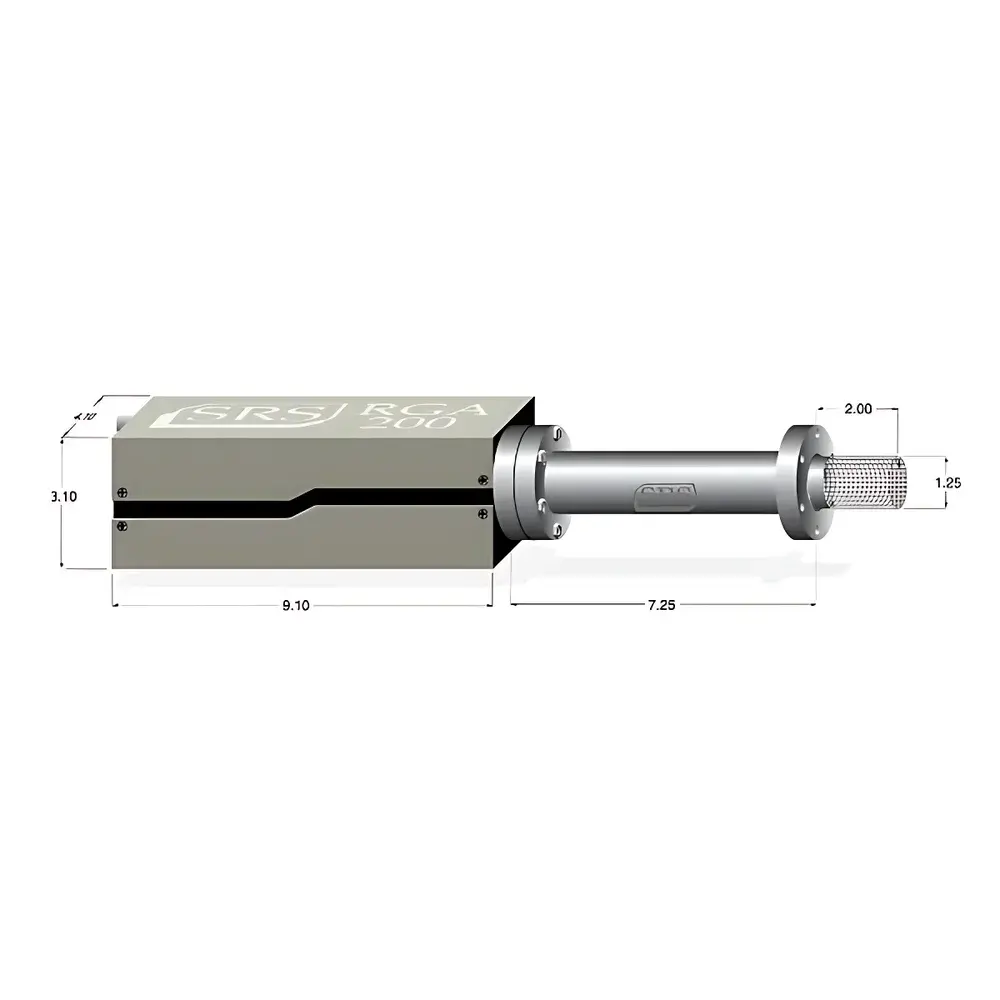
| Sample Tube Dimensions | Ø24.2 mm × H25 mm |
| Measurement Time | ≤ 3 min per sample |
Overview
The NIUMAG PQ001-12 Solid-State Electrolyte Dispersion Analyzer is a purpose-built low-field nuclear magnetic resonance (LF-NMR) spectrometer engineered for quantitative characterization of dispersion homogeneity in solid-state electrolyte composites. Unlike high-field NMR systems optimized for molecular structure elucidation, this instrument leverages the sensitivity of proton (1H) spin–lattice (T1) and spin–spin (T2) relaxation dynamics to probe local molecular mobility, interfacial interactions, and phase distribution within heterogeneous solid–liquid mixtures. In solid-state battery development, dispersion quality directly governs ionic conductivity, interfacial resistance, and long-term cycling stability. Poor dispersion—arising from mismatched polarity between solid electrolyte particles and low-polarity solvents or binders (e.g., aromatic hydrocarbons or styrenic elastomers)—induces particle agglomeration, reduced effective surface area, and non-uniform ion transport pathways. The PQ001-12 detects these microstructural variations through differential relaxation signatures: tightly bound protons at particle surfaces exhibit short T2 times (< 1 ms), while mobile solvent protons display longer T2 components (> 10 ms). This enables non-destructive, statistically representative quantification of dispersed phase fraction, agglomerate size distribution, and binder–electrolyte interaction strength—without calibration standards or sample destruction.
Key Features
- Permanent magnet system delivering stable 0.5 T ± 0.03 T field—optimized for robustness, minimal drift, and zero cryogen dependency.
- Dedicated RF probe tuned for 1H detection in composite electrolyte slurries, accommodating standard Ø24.2 mm × 25 mm cylindrical sample tubes.
- Integrated pulse sequence library including CPMG (Carr–Purcell–Meiboom–Gill) for high-fidelity T2 distribution analysis and inversion recovery for T1 mapping.
- Modular software interface with separated measurement setup and real-time result visualization panels—eliminating workflow interruption during acquisition.
- Sub-3-minute measurement cycle time per sample, supporting high-throughput screening of formulation variants and process parameters.
- No user-specific NMR expertise required: automated shimming, signal optimization, and baseline correction embedded in firmware.
Sample Compatibility & Compliance
The PQ001-12 accepts solid–liquid composite samples—including sulfide-, oxide-, and polymer-based solid electrolytes suspended in aromatic solvents (e.g., toluene, xylene), ether derivatives (e.g., DOL/DME), or low-polarity binders (e.g., SBS, SEBS). It accommodates both slurry-state and semi-cured composite films (thickness ≤ 2 mm). All hardware and software comply with IEC 61000-6-3 (EMC emission standards) and ISO/IEC 17025:2017 principles for testing laboratory competence. Data integrity aligns with GLP and GMP documentation requirements: audit trails record operator ID, timestamp, parameter settings, raw FID data, and post-processing steps. While not FDA 21 CFR Part 11–certified out-of-the-box, the system supports electronic signature integration and secure user access control when deployed in regulated R&D environments.
Software & Data Management
The proprietary NIUMAG NMR Analysis Suite provides a unified platform for acquisition, processing, and reporting. Key modules include: (1) Relaxation Spectrum Deconvolution—applying non-negative least-squares (NNLS) algorithms to resolve multi-exponential T2 decays into discrete components linked to physical phases; (2) Dispersion Index Calculator—quantifying homogeneity via T2 distribution width (FWHM) and peak asymmetry metrics; (3) Batch Processing Engine—for comparative analysis across formulation libraries; and (4) Export-Ready Reporting—generating PDF/CSV outputs compliant with internal SOPs and cross-functional review workflows. All raw data (FID, spectrum, metadata) are stored in vendor-neutral HDF5 format, ensuring long-term archival and third-party tool interoperability (e.g., MATLAB, Python SciPy).
Applications
- Quantitative assessment of solid electrolyte dispersion uniformity in slurry formulations prior to coating.
- Optimization of solvent polarity and binder selection by correlating T2 spectral features with ionic conductivity and electrochemical impedance spectroscopy (EIS) results.
- In-process monitoring of aging-induced agglomeration during slurry storage.
- Characterization of crosslinking density in polymer electrolyte membranes via T1/T2 ratio analysis.
- Resin content determination in composite electrodes using calibrated relaxation contrast.
- Crystallinity evaluation of polyethylene/polypropylene separators and polyamide-based solid electrolytes.
- Oil/water phase distribution analysis in emulsion-type gel electrolytes.
FAQ
What sample preparation is required?
Minimal preparation: slurries are loaded directly into standard glass tubes; no drying, grinding, or dilution is needed. Viscosity should remain below 5000 mPa·s to ensure homogeneous packing.
Can the instrument distinguish between different solid electrolyte chemistries (e.g., Li7La3Zr2O12 vs. Li3PS4)?
No—LF-NMR does not provide chemical identification. It resolves differences in proton environment mobility, not elemental composition. Chemistry-specific interpretation requires complementary techniques (e.g., XRD, XPS).
Is temperature control available?
The base configuration operates at ambient temperature (20–25 °C). Optional Peltier-controlled sample holder (-10 °C to +60 °C) is available for thermal dispersion studies.
How is data reproducibility ensured across operators?
Automated parameter optimization, fixed pulse sequence protocols, and standardized tube geometry eliminate operator-dependent variables. Inter-laboratory CV for T2 mean values is ≤ 2.3% (n = 15, same batch slurry).
Does the system support method validation per ICH Q2(R2)?
Yes—the software supports linearity, precision, accuracy, and robustness testing protocols. Validation templates and raw data logs meet ICH Q2(R2) documentation expectations for analytical procedure qualification.
Related Products
")