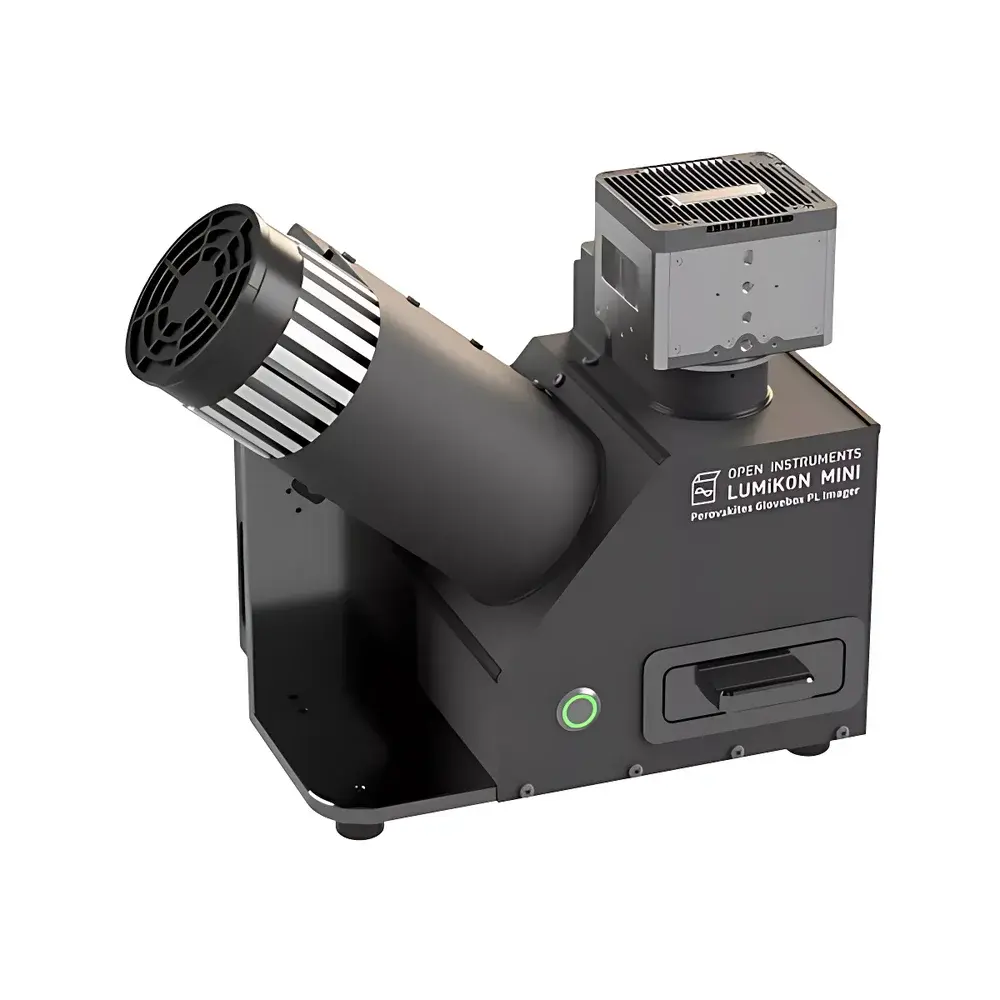
Open Instruments LUMiKON MINI iVoc Imaging System for Perovskite and Tandem Solar Cells
| Brand | Open Instruments |
|---|---|
| Origin | Imported |
| Manufacturer Type | Authorized Distributor |
| Model | LUMiKON MINI |
| Trigger Mode | Steady-State |
| Dimensions (W×H×D) | 32.5 × 37 × 20.8 cm |
| Imaging Sensor | 26 MP (upgradable to 61 MP) |
| Uniformity | >95% |
| Illumination Range | 0.01–1.2 suns (AM1.5G equivalent) |
| Core Output Metrics | Quantitative iVoc, iFF, iMPP, and PL intensity maps |
| Environmental Compatibility | Glovebox-integrated (O₂ < 0.1 ppm, H₂O < 0.1 ppm) |
| Calibration | Absolute radiometric PL calibration with NIST-traceable reference source |
Overview
The Open Instruments LUMiKON MINI iVoc Imaging System is a purpose-built, glovebox-compatible photoluminescence (PL) characterization platform engineered for quantitative, spatially resolved assessment of perovskite, silicon-perovskite tandem, and emerging thin-film photovoltaic devices. Unlike conventional PL imagers, the LUMiKON MINI implements calibrated, absolute radiometric detection—enabling direct conversion of pixel-wise PL intensity into physically meaningful parameters including implied open-circuit voltage (iVoc), implied fill factor (iFF), and implied maximum power point (iMPP). Its operation is grounded in the fundamental relationship between quasi-Fermi level splitting (QFLS) and PL quantum yield under low-injection, steady-state excitation. By coupling high-dynamic-range imaging with traceable irradiance calibration and real-time computational mapping, the system delivers non-contact, non-destructive metrics that correlate strongly with device-level J-V performance—without requiring electrical contacts or biasing.
Key Features
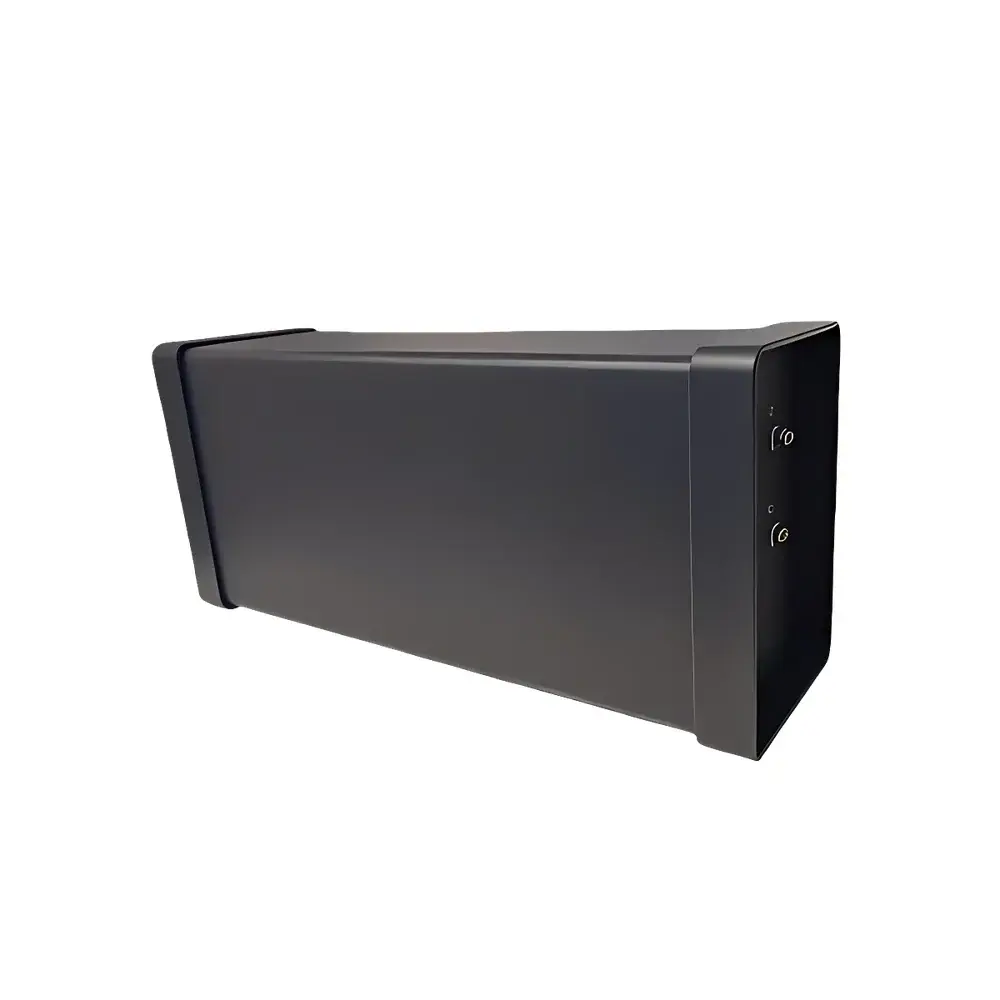
- Glovebox-integrated compact design (32.5 × 37 × 20.8 cm) enabling in-situ, inert-atmosphere characterization of air-sensitive perovskite and tandem samples
- 26 MP scientific CMOS sensor (upgradable to 61 MP) with >95% optical uniformity across field-of-view, minimizing correction artifacts
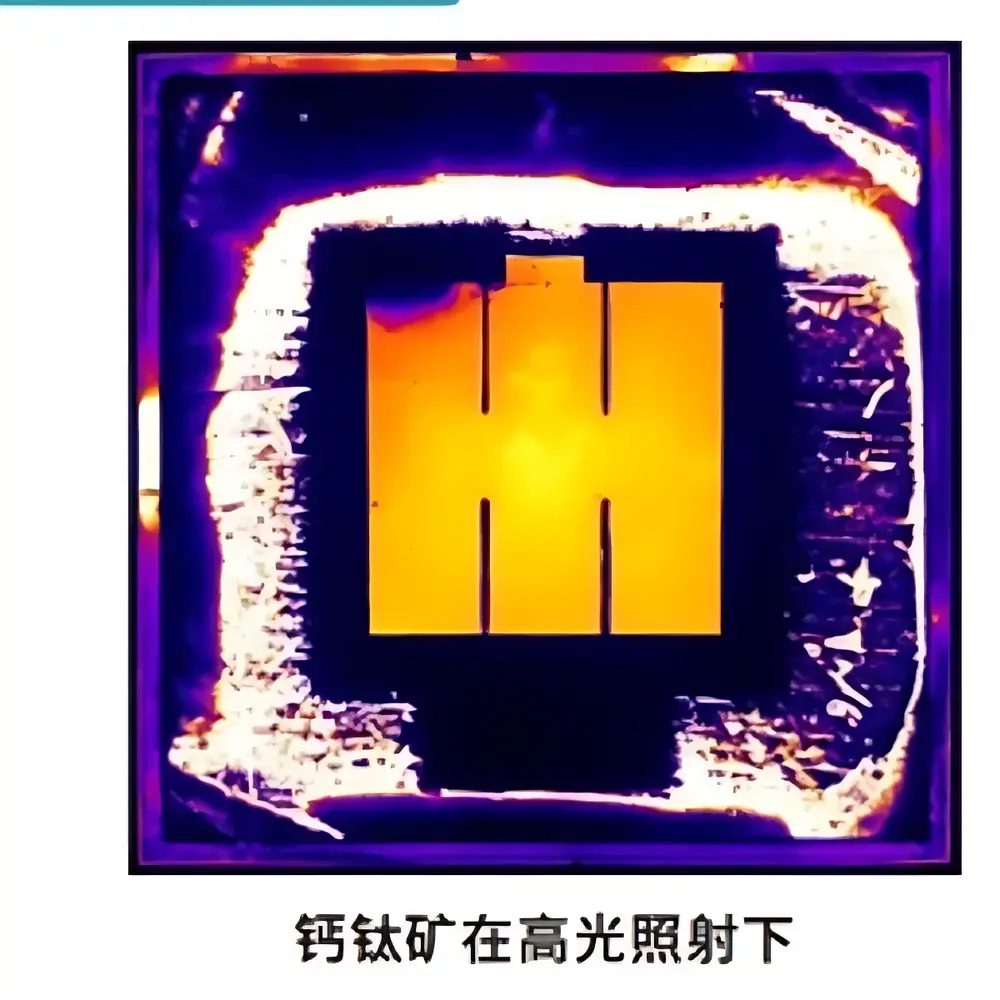
- Steady-state illumination module delivering tunable, spectrally stable excitation from 0.01 to 1.2 suns (AM1.5G-equivalent, calibrated via NIST-traceable reference detector)
- Fully automated acquisition and processing pipeline—including dark-frame subtraction, lens distortion correction, vignetting compensation, and pixel-wise radiometric calibration
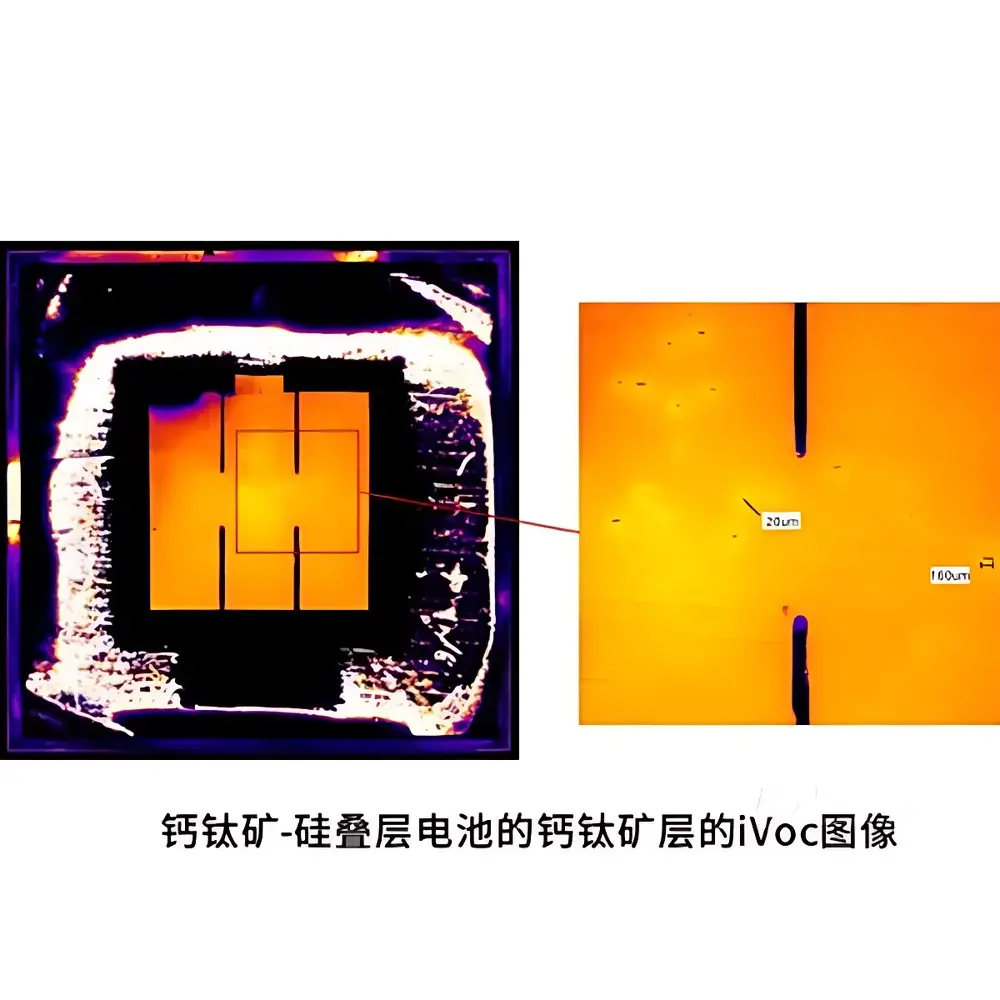
- Real-time generation of quantitative parameter maps: iVoc (in volts), iFF (unitless), iMPP (in W/cm²), and normalized PL quantum efficiency (PLQE)
- No sample degradation risk during measurement: contactless optical interrogation eliminates probe-induced stress, thermal loading, or surface contamination
Sample Compatibility & Compliance
The LUMiKON MINI supports planar and textured substrates up to 10 × 10 cm², accommodating standard perovskite solar cell architectures (e.g., n-i-p, p-i-n), monolithic perovskite/silicon tandems, and emerging all-perovskite stacks. Its optical path is optimized for emission bands spanning 400–1100 nm—covering both perovskite band-edge luminescence (~750–850 nm) and c-Si subcell emission (~1100 nm). All calibration protocols adhere to ISO/IEC 17025 principles for measurement traceability. Data acquisition logs include timestamped metadata (exposure time, irradiance, integration gain, ambient O₂/H₂O levels) to support GLP-compliant reporting and audit readiness. The system architecture meets foundational requirements for integration into FDA 21 CFR Part 11–aligned workflows when deployed with validated electronic lab notebook (ELN) interfaces.
Software & Data Management
LUMiKON Control Suite v3.x provides a deterministic, scriptable acquisition environment built on Python-based core libraries and Qt-based GUI. It supports batch-mode acquisition across multiple samples, ROI-defined subfield scanning, and export of fully annotated TIFF stacks (with embedded EXIF metadata). Processed parameter maps are saved in HDF5 format, preserving pixel-level uncertainty estimates derived from photon shot noise and calibration error propagation. The software includes built-in statistical tools for spatial correlation analysis (e.g., grain-to-grain iVoc variance, edge vs. bulk performance gradients) and integrates with MATLAB, Python (NumPy/Pandas), and Origin for advanced modeling. Audit trails record every user action, parameter change, and calibration event—enabling full reproducibility and version-controlled experiment documentation.
Applications
- Rapid screening of perovskite composition gradients (e.g., Br/I ratio, Cs/FA/MA mixing) via spatial iVoc and bandgap-mapped PL spectra
- Quantifying recombination losses at interfaces and grain boundaries in polycrystalline films through iVoc homogeneity analysis
- Optimizing charge transport layers (ETL/HTL) by correlating local PL quenching with iFF distribution
- Validating monolithic tandem interconnection quality via simultaneous mapping of perovskite top-cell and Si bottom-cell PL signatures
- Monitoring degradation kinetics under controlled illumination and bias stress, with pixel-wise temporal tracking of iVoc decay
- Supporting DOE-driven process optimization by linking fabrication variables (annealing temperature, anti-solvent drip timing) to spatial performance metrics
FAQ
What does “iVoc” represent, and how is it calculated from PL data?
iVoc is the implied open-circuit voltage derived from the quasi-Fermi level splitting inferred from absolute PL intensity under open-circuit conditions. It is computed using the relation: iVoc = (kT/q)·ln(PL/PL₀), where PL₀ is the radiative limit intensity determined from bandgap and absorption profile.
Can the LUMiKON MINI operate outside a glovebox?
Yes—though designed for inert-atmosphere integration, it functions in ambient air; however, iVoc accuracy for oxygen-sensitive perovskites degrades rapidly without O₂/H₂O control.
Is spectral resolution supported in the current MINI configuration?
The base MINI model performs broadband PL imaging; optional add-on modules enable point-scanning micro-PL spectroscopy (resolution ≤2 nm) for bandgap and phase uniformity mapping.
How is radiometric calibration maintained over time?
Calibration is performed using a factory-characterized, NIST-traceable LED reference source; users can execute routine verification checks via integrated shutter-based self-calibration routines.
Does the system support synchronization with external stimuli (e.g., bias voltage, temperature ramp)?
Yes—via TTL-triggered acquisition mode and programmable I/O ports, enabling correlated PL/iVoc response under variable bias, thermal cycling, or illumination modulation.