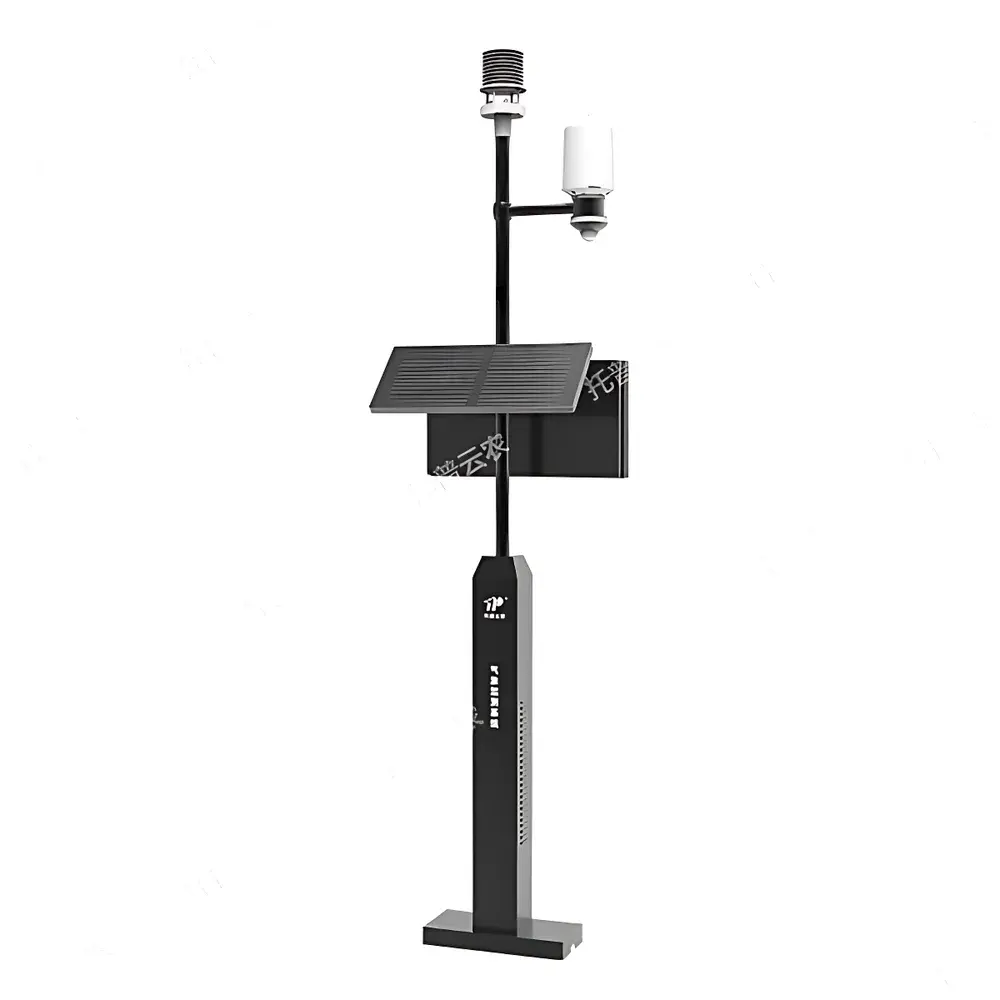
TopCloud-agri TP-WHL & TP-WHY Plant Phenology Monitoring System
| Brand | TopCloud-agri |
|---|---|
| Origin | Zhejiang, China |
| Manufacturer Type | OEM/ODM Manufacturer |
| Country of Origin | China |
| Model Numbers | TP-WHL (Visible-light Imaging), TP-WHY (Multispectral Imaging) |
| Pricing | Available Upon Request |
Overview
The TopCloud-agri TP-WHL and TP-WHY Plant Phenology Monitoring Systems are field-deployable, IoT-integrated environmental-phenotypic observatories engineered for long-term, unattended monitoring of vegetation dynamics in agricultural and ecological research settings. These systems operate on a dual-data paradigm: synchronized acquisition of high-resolution spectral imagery and high-fidelity microclimatic measurements enables rigorous analysis of plant–environment interactions across diurnal, seasonal, and interannual timescales. The TP-WHL variant integrates a visible-light imaging module calibrated for canopy structure and color-based phenotypic trait extraction (e.g., canopy cover, height estimation, greenness indices), while the TP-WHY variant employs a scientific-grade multispectral camera with spectral bands optimized for vegetation index derivation—including NDVI, GNDVI, NDRE, OSAVI, and LCI—supporting quantitative assessment of photosynthetic activity, nitrogen status, and senescence progression. Both models adhere to principles of passive optical remote sensing and microclimate metrology, delivering traceable, time-stamped datasets suitable for integration into FAO-recommended phenological frameworks and IPCC-aligned land-surface monitoring protocols.
Key Features
- Uninterrupted Field Operation: IP67-rated enclosure with solar-charged battery system enables continuous 24/7 data collection over extended deployment periods (≥12 months without maintenance).
- Synchronized Multimodal Sensing: Simultaneous timestamped capture of spectral imagery and 12+ environmental parameters—including air temperature/humidity, PAR-equivalent irradiance, four-layer soil moisture/temperature profiles, ultrasonic wind speed/direction, tipping-bucket rainfall, and barometric pressure.
- Calibrated Spectral Imaging: Built-in ambient light sensor performs real-time radiometric correction; 400 MP effective resolution with 32× optical zoom ensures sub-canopy detail retention under variable illumination conditions.
- Phenophase Detection Engine: On-device algorithm suite identifies discrete phenological stages—including emergence, stem elongation, flowering onset, fruit set, and leaf senescence—using temporal trajectory analysis of spectral indices and morphological features.
- Modular Deployment Architecture: Pole-mountable design supports rapid installation across heterogeneous terrain (field plots, orchards, greenhouse perimeters); scalable network topology allows clustering of multiple units for spatial interpolation and validation against eddy covariance or flux tower networks.
Sample Compatibility & Compliance
The system is validated for use with herbaceous and woody perennial crops (e.g., rice, wheat, maize, soybean, grapevine, apple), native grassland species, and experimental model plants (Arabidopsis thaliana, Brachypodium distachyon). All environmental sensors comply with ISO 17025-accredited calibration traceability pathways. Soil moisture probes meet ASTM D5859-20 standards for volumetric water content measurement in mineral soils. Air temperature/humidity modules conform to WMO Guide to Instruments and Methods of Observation (CIMO Guide, Chapter 4) specifications for field meteorology. Data logging firmware supports configurable sampling intervals (1 min to 24 h) and implements automatic outlier rejection per IEC 61508 functional safety guidelines. System architecture accommodates GLP-compliant audit trails and meets baseline requirements for FAO’s Global Agro-Monitoring Initiative (GAMI) metadata schema.
Software & Data Management
Data ingestion occurs via LTE-M/NB-IoT uplink to a secure, role-based cloud platform compliant with ISO/IEC 27001 information security standards. Raw sensor streams and georeferenced image stacks are stored in HDF5 format with embedded CF-conventions metadata. The web interface provides batch processing workflows for vegetation index time-series generation, phenophase transition detection (using logistic curve fitting per USGS Phenology Program methodology), and cross-parameter correlation heatmaps (e.g., soil moisture vs. NDVI lag analysis). API endpoints support direct integration with R/Python analytical environments (e.g., phenoptr, vegindex, cropR) and institutional LIMS platforms. Audit logs record all user actions, configuration changes, and firmware updates in alignment with FDA 21 CFR Part 11 electronic record requirements.
Applications
- Agronomic research: Quantifying genotype-by-environment interactions in breeding trials through longitudinal canopy development metrics.
- Climate impact studies: Detecting shifts in thermal accumulation thresholds for key phenophases under warming scenarios.
- Pest & disease forecasting: Correlating canopy spectral anomalies (e.g., early NDRE depression) with aphid infestation or fungal pathogen incidence.
- Irrigation scheduling optimization: Deriving crop water stress indices (CWSI) from thermal–multispectral fusion (when paired with optional thermal module).
- National phenological network infrastructure: Serving as Tier-2 ground-truth nodes for satellite validation (Sentinel-2, Landsat 9, ECOSTRESS).
- Ecosystem service modeling: Providing input data for biogeochemical models (e.g., APSIM, LPJ-GUESS) requiring phenologically resolved LAI and carbon assimilation drivers.
FAQ
What distinguishes the TP-WHL from the TP-WHY model?
The TP-WHL uses a high-resolution visible-light camera optimized for structural phenotyping (canopy height, coverage, color-based vigor indices), whereas the TP-WHY integrates a calibrated multispectral imager with narrowband filters for vegetation index computation and physiological status assessment.
Are calibration certificates provided with each sensor unit?
Yes—each environmental sensor module ships with a factory calibration report traceable to NIM (National Institute of Metrology, China) standards; optional ISO/IEC 17025 third-party recalibration services are available annually.
Can the system operate independently without cellular connectivity?
Yes—onboard SD card storage supports local buffering of up to 18 months of full-resolution data; LTE/NB-IoT transmission resumes automatically upon signal restoration.
Is the software platform compatible with existing GIS or statistical analysis tools?
All exported datasets follow OGC SensorML and NetCDF-CF conventions; RESTful APIs enable bidirectional synchronization with ArcGIS Enterprise, QGIS, RStudio, and MATLAB environments.
How is data integrity ensured during long-term deployments?
Dual redundancy is implemented: onboard watchdog timers trigger automatic sensor self-diagnosis and reinitialization; checksum-verified firmware updates prevent corruption; and all transmitted packets include SHA-256 signatures for tamper detection.
Related Products