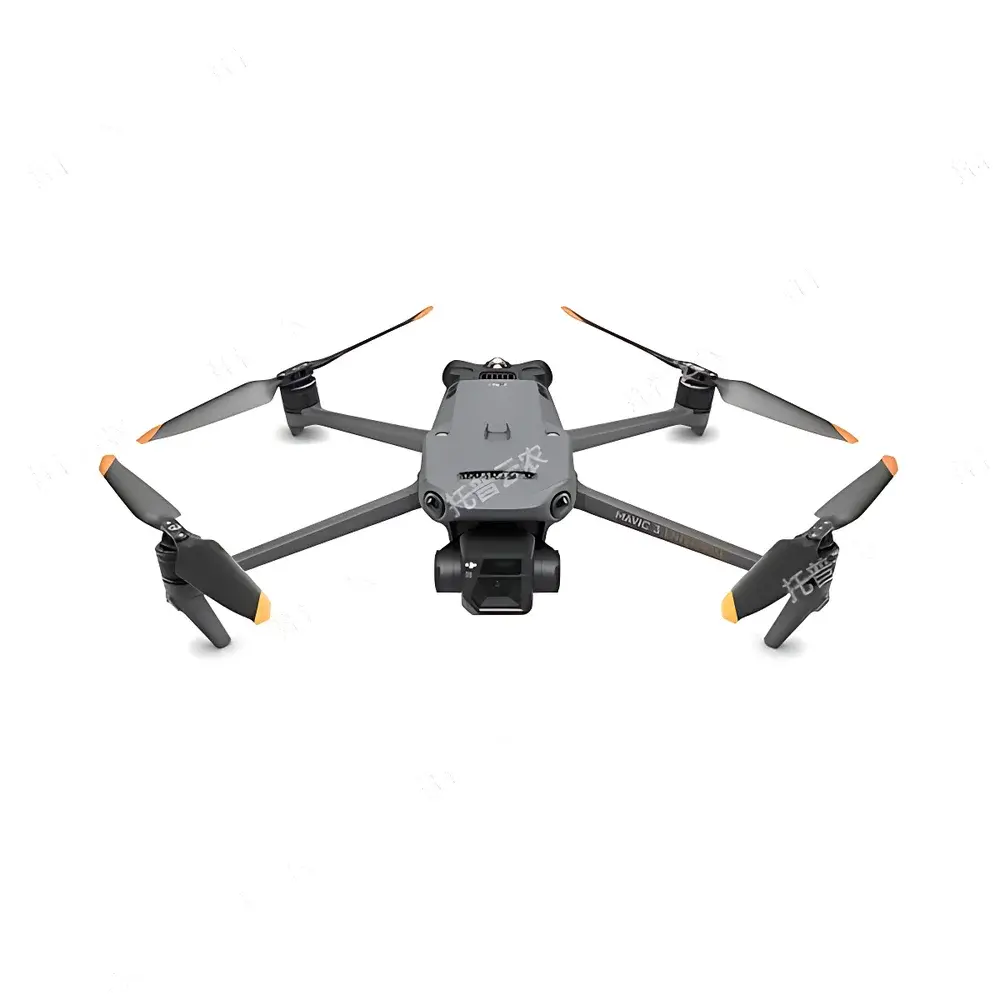
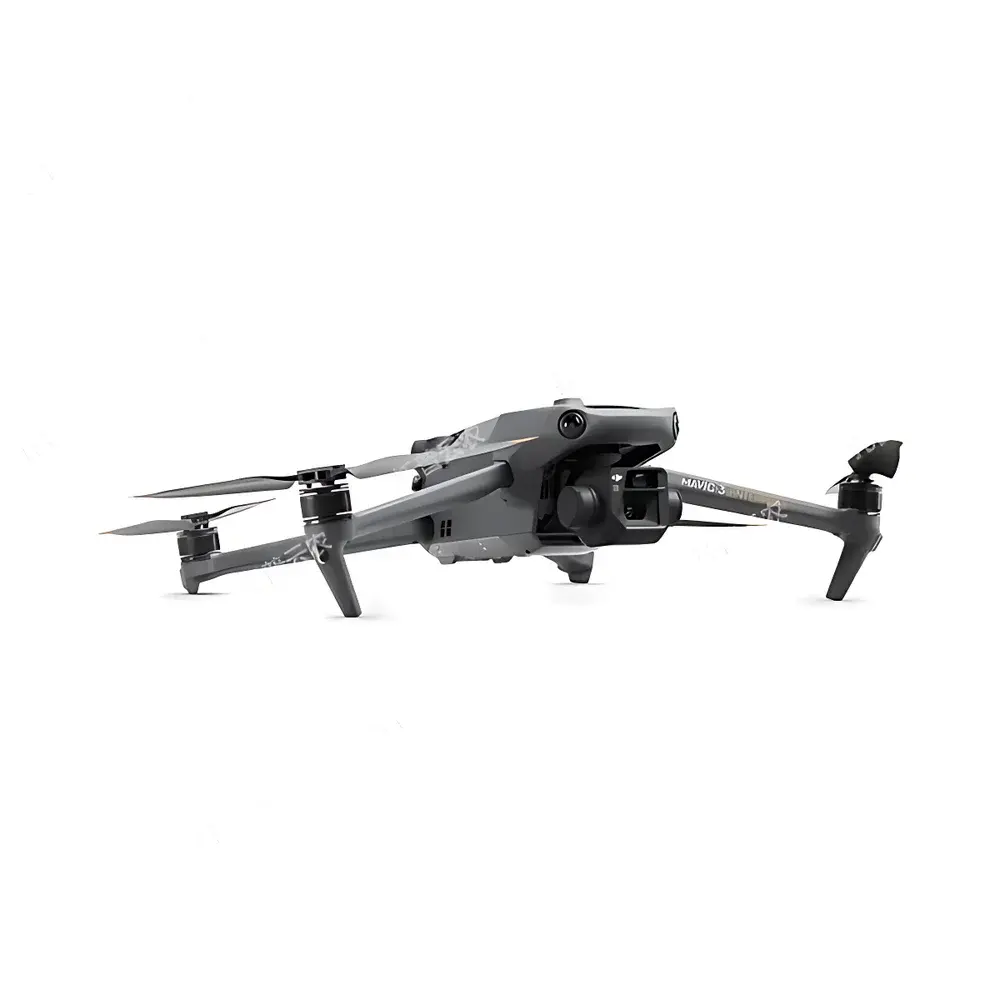
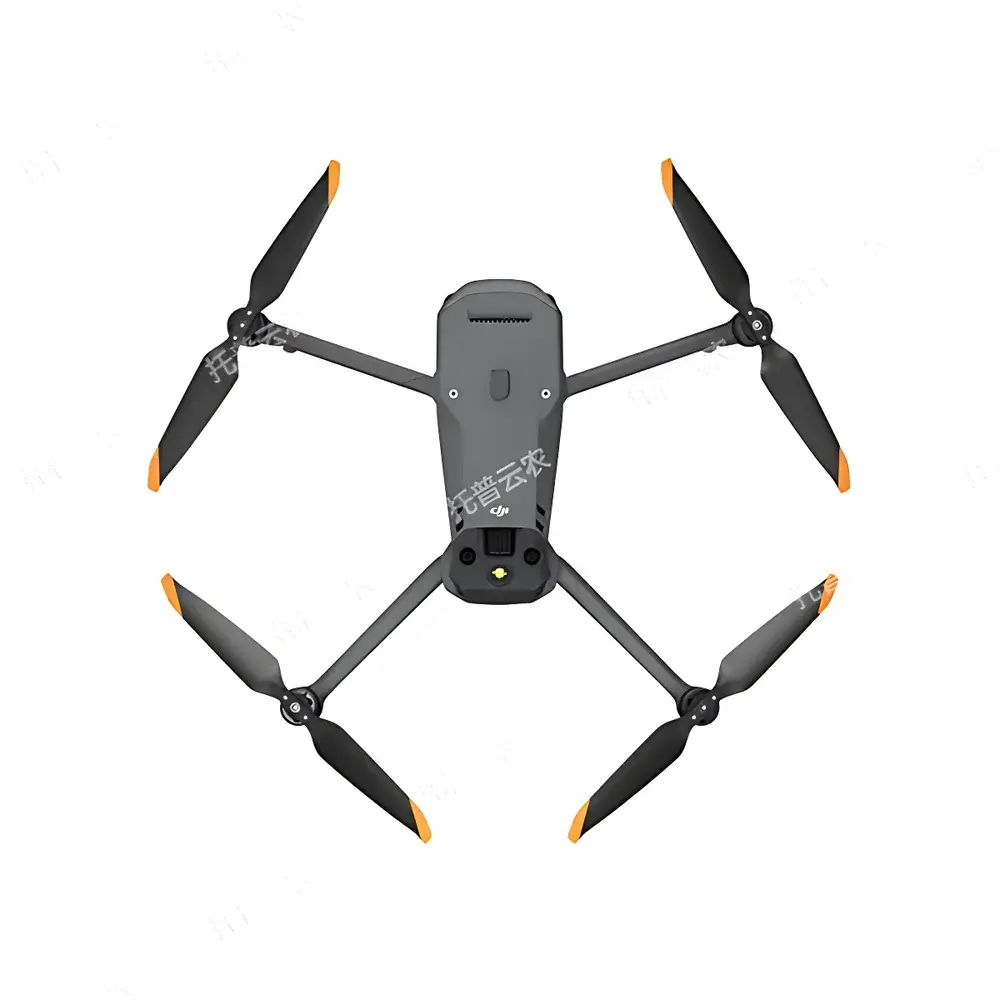
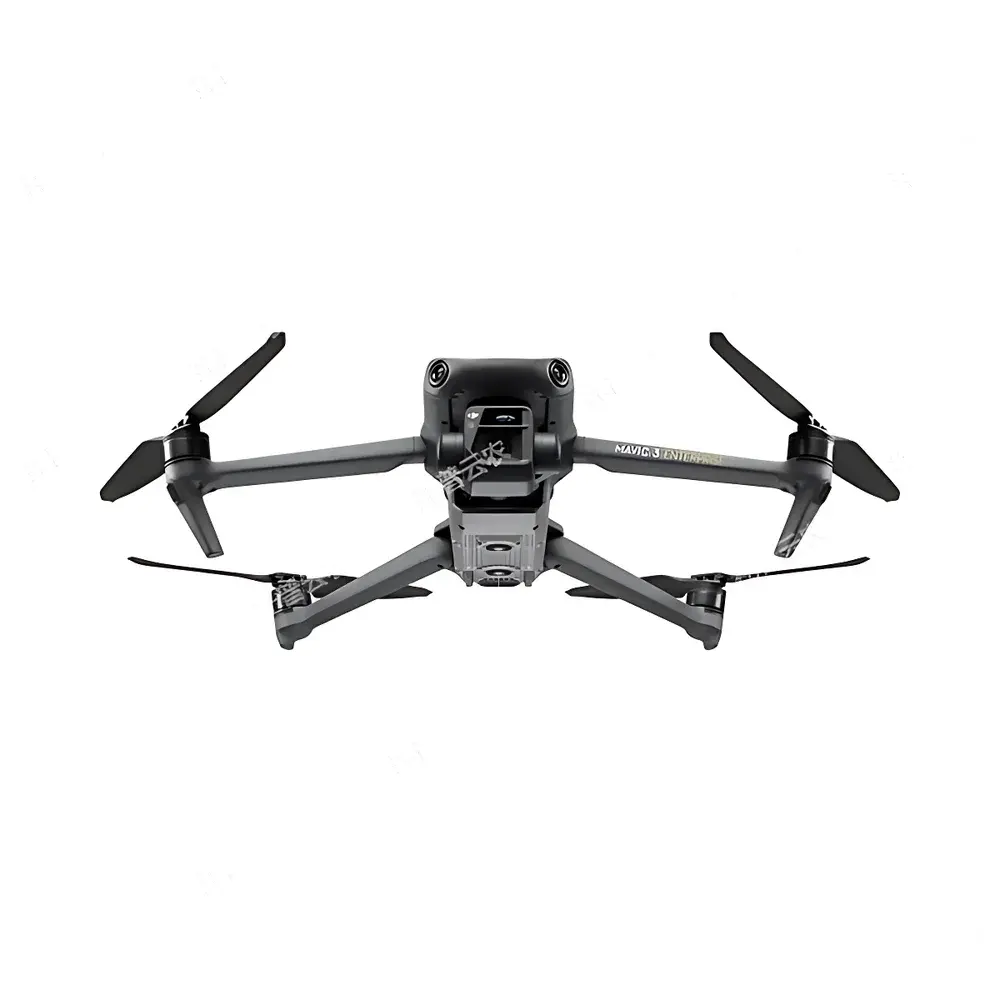
Top Cloud-agri TP-KJG-DM Drone-Based Plant Phenotyping Platform for Rice and Wheat Growth Cycle Monitoring
| Brand | Top Cloud-agri |
|---|---|
| Origin | Zhejiang, China |
| Manufacturer Type | OEM Manufacturer |
| Country of Origin | China |
| Model | TP-KJG-DM |
| Pricing | Upon Request |
| Flight Time (max, no wind) | 45 min |
| Max Operating Range | 32 km |
| Sensor Configuration | 4/3" CMOS Wide-Angle Camera (20 MP), 1/2" CMOS Telephoto Camera (12 MP) |
| Image Formats | JPEG, DNG (RAW) |
| RTK Positioning Support | Yes |
| Vertical Hover Accuracy (RTK) | ±0.1 m |
| Horizontal Hover Accuracy (RTK) | ±0.1 m |
| Operating Temperature | −10°C to 40°C |
| Max Horizontal Speed | 15 m/s |
| Max Wind Resistance | 12 m/s |
| Real-time Video Transmission | 1080p/30fps |
Overview
The Top Cloud-agri TP-KJG-DM Drone-Based Plant Phenotyping Platform is a field-deployable, multi-sensor aerial monitoring system engineered for longitudinal, non-destructive phenotypic assessment of rice and wheat across their complete ontogenetic cycle—from emergence through tillering, booting, heading, grain filling, and senescence. Built upon a dual-camera UAV architecture with integrated RTK-GNSS positioning, the platform implements passive optical remote sensing principles grounded in reflectance-based vegetation index derivation (e.g., NDVI, GNDVI, RGB-based VIs), geometric reconstruction via structure-from-motion (SfM), and deep learning–driven pixel-level segmentation for morphological trait extraction. Unlike lab-bound or greenhouse phenotyping rigs, this system delivers field-scale spatial resolution (sub-centimeter ground sampling distance under optimal flight parameters) while maintaining temporal consistency across repeated surveys—enabling robust time-series analysis of canopy dynamics, structural development, and stress response trajectories. Its design aligns with FAO’s framework for digital agriculture infrastructure and supports ISO 11783-10 (Tractor and machinery data exchange) and OGC SensorThings API compatibility for interoperability within broader agri-IoT ecosystems.
Key Features
- Full-Growth-Cycle Trait Quantification: Algorithms calibrated for rice and wheat quantify emergence rate, phenological stage (BBCH scale), plant height (via stereo photogrammetry), fractional canopy cover (FCC), lodging severity index, panicle count per unit area, and yield proxy metrics derived from spikelet density and normalized biomass accumulation trends.
- Autonomous Mission Execution: Predefined geofenced flight paths support fully autonomous takeoff, waypoint navigation, image capture at user-specified altitudes and overlap ratios (70% forward, 60% side), and return-to-home—all compliant with ICAO Annex 2 operational guidelines for low-altitude UAS in agricultural zones.
- High-Precision Georeferencing: Dual-frequency RTK module enables centimeter-level absolute positioning (horizontal & vertical ±0.1 m) without ground control points, ensuring repeatable spatial registration across multi-temporal datasets for change detection analysis.
- Integrated Environmental Data Fusion: Onboard telemetry synchronizes with external IoT sensors—including wireless weather stations (temperature, RH, PAR, precipitation) and soil moisture/EC probes—via LoRaWAN or NB-IoT, enabling multivariate correlation of phenotypic responses with microclimatic and edaphic variables.
- Adaptive Model Refinement: Supervised correction interface allows domain experts to manually annotate misclassified pixels or bounding boxes; annotated feedback triggers incremental retraining of convolutional neural networks (CNNs), improving model accuracy over successive deployments.
- Regulatory-Ready Data Governance: All processing logs, raw imagery timestamps, sensor calibration metadata, and user audit trails are stored with SHA-256 hashing and immutable timestamps—meeting baseline requirements for GLP-compliant field trials and USDA APHIS data submission protocols.
Sample Compatibility & Compliance
The TP-KJG-DM platform is validated for monocot cereal species including Oryza sativa (indica/japonica subspecies) and Triticum aestivum, under both irrigated and rainfed field conditions. It accommodates variable planting densities (100–300 plants/m²), row spacings (15–30 cm), and canopy architectures typical of modern high-yielding varieties. System outputs comply with MIAPPE v1.1 (Minimum Information About a Plant Phenotyping Experiment) metadata standards and support export to ISA-Tab format for integration into ELN systems such as LabArchives or Benchling. All hardware components conform to CE RED Directive 2014/53/EU, FCC Part 15 Subpart C, and RoHS 2011/65/EU. Flight operations adhere to national civil aviation authority regulations (e.g., EASA UAS Implementing Rules, FAA Part 107, CAAC CCAR-92), with built-in geo-awareness to enforce no-fly zone restrictions.
Software & Data Management
The proprietary PhenotypeCloud™ analytics suite provides browser-based access to orthomosaic generation, 3D point cloud reconstruction, time-series trait dashboards, and statistical modeling modules (linear mixed-effects models, principal component analysis). Data ingestion pipelines accept inputs from third-party sources—including hyperspectral scanners, thermal imagers, and handheld spectrometers—via standardized CSV/GeoJSON/API endpoints. Role-based access control (RBAC) enforces separation of duties between field operators, data scientists, and regulatory reviewers. Audit logs record all data transformations, user logins, and export events in accordance with FDA 21 CFR Part 11 electronic record/electronic signature (ERES) requirements. Export formats include Excel (.xlsx), georeferenced GeoTIFFs, interactive HTML reports with embedded Plotly visualizations, and PDF summaries with embedded metadata signatures.
Applications
- Quantitative trait locus (QTL) mapping studies requiring high-temporal-resolution canopy architecture data across segregating populations.
- Evaluation of drought, heat, or nitrogen-stress tolerance in breeding nurseries using dynamic growth rate metrics and stress-induced spectral shifts.
- Validation of crop growth models (e.g., APSIM, DSSAT) through direct comparison of simulated vs. observed LAI, biomass partitioning, and phenophase timing.
- Operational decision support for precision input application—e.g., variable-rate nitrogen topdressing guided by real-time SPAD-equivalent indices derived from RGB-VIs.
- Post-disaster agronomic damage assessment (e.g., typhoon-induced lodging, flood submergence) for insurance claim verification and government compensation programs.
- Long-term monitoring of climate adaptation traits in regional variety trials coordinated under the International Treaty on Plant Genetic Resources for Food and Agriculture (ITPGRFA).
FAQ
Does the system support integration with existing farm management software (e.g., Climate FieldView, Granular)?
Yes—via RESTful API and AgGateway ADAPT-compliant adapters for bidirectional synchronization of field boundaries, operation plans, and phenotypic reports.
Can raw imagery be processed offline using open-source tools like OpenDroneMap or Agisoft Metashape?
Absolutely. The platform exports geotagged JPEG/DNG files with EXIF GPS tags and IMU metadata compatible with standard photogrammetric workflows.
What level of technical expertise is required to operate the system in routine field conditions?
Field technicians require only basic UAV piloting certification (e.g., Part 107 or equivalent); full automation minimizes manual intervention, and the web interface includes contextual tooltips and guided workflow wizards.
How frequently can surveys be conducted without inducing crop disturbance or violating local airspace rules?
With optimized flight parameters (e.g., 30–50 m AGL, >5 m/s ground speed), surveys may be repeated weekly during critical growth windows without physical impact; all missions automatically respect local NOTAMs and controlled airspace layers via integrated UTM service providers.
Is the platform validated for use in regulatory submission packages (e.g., EPA pesticide efficacy trials, OECD GLP studies)?
Yes—validation documentation includes measurement uncertainty budgets per ISO/IEC 17025, repeatability studies across three seasons and five locations, and traceable calibration certificates for onboard inertial measurement units and GNSS receivers.