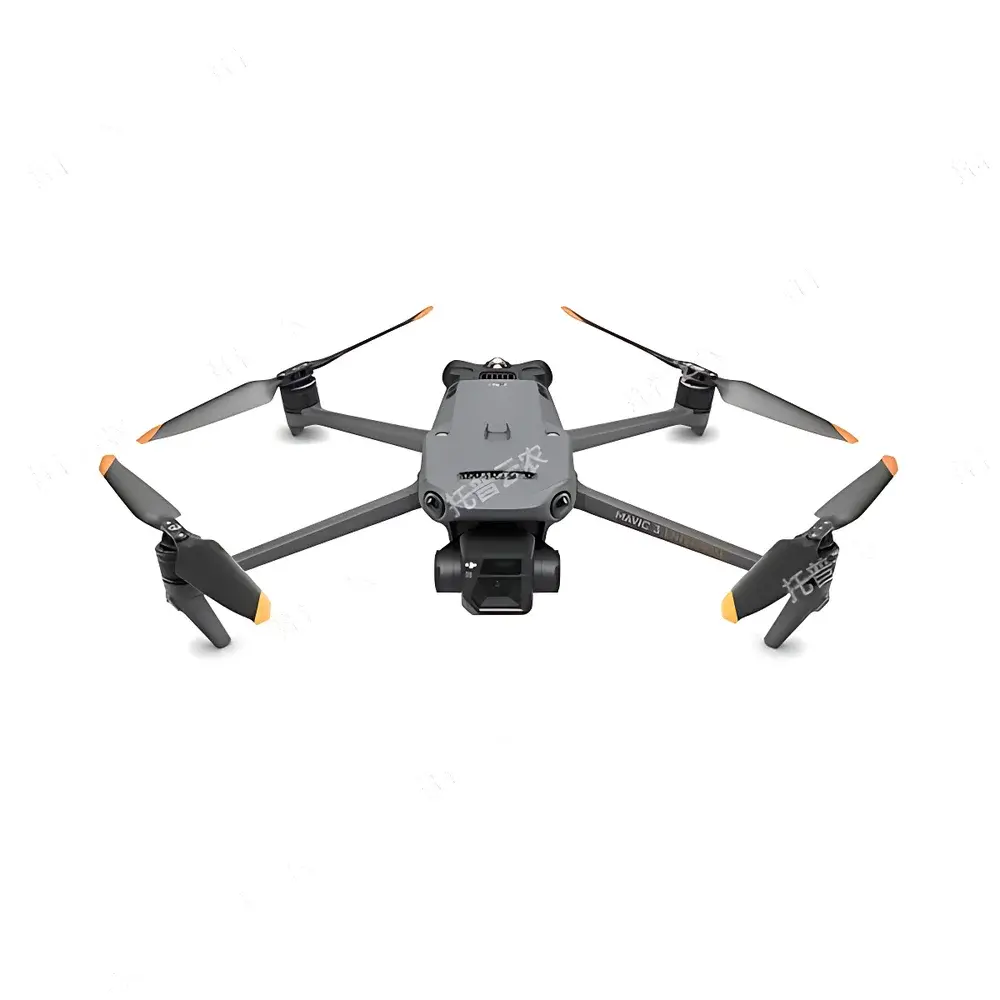
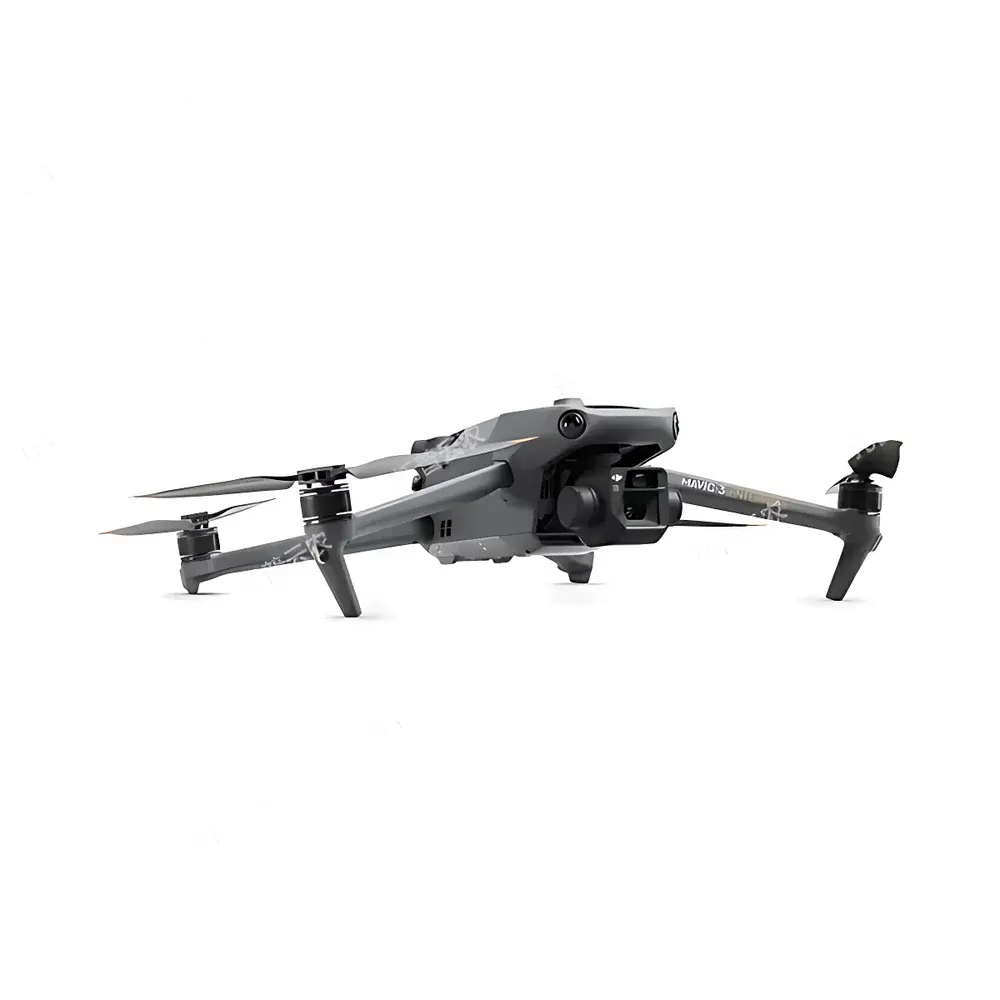
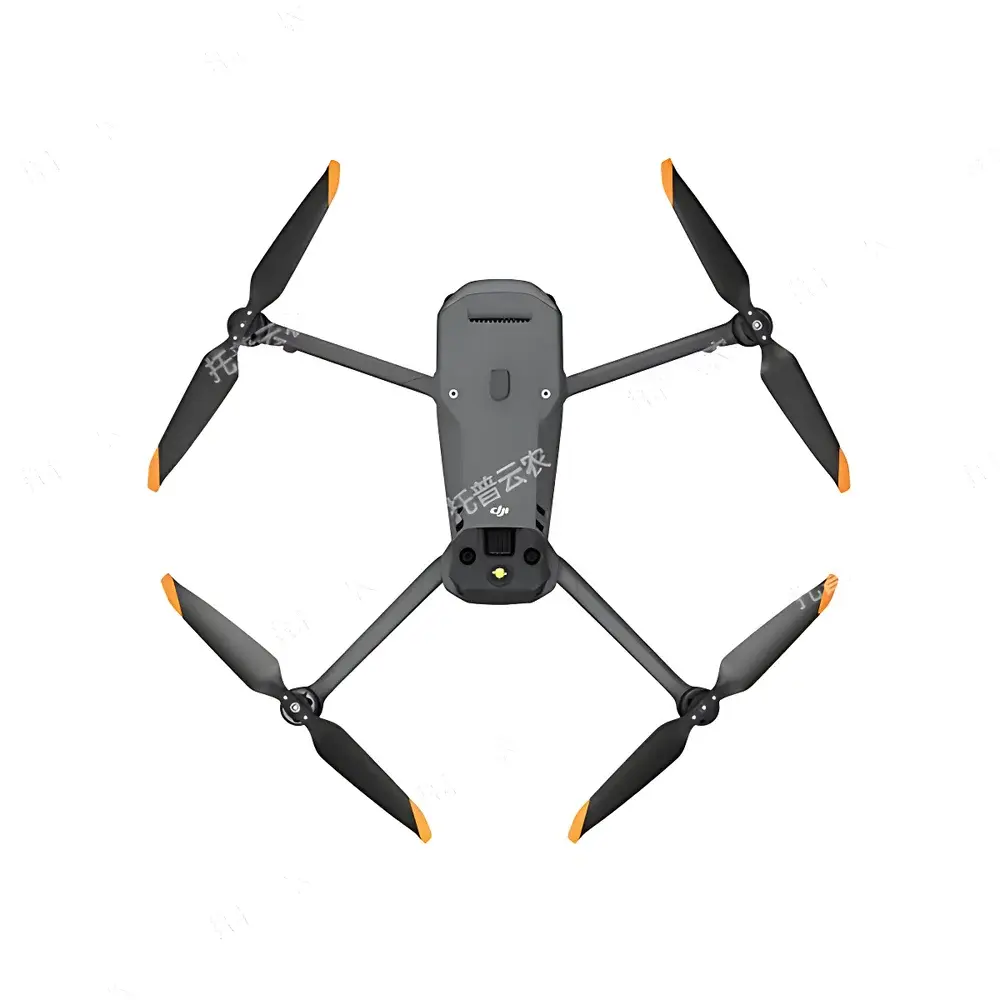
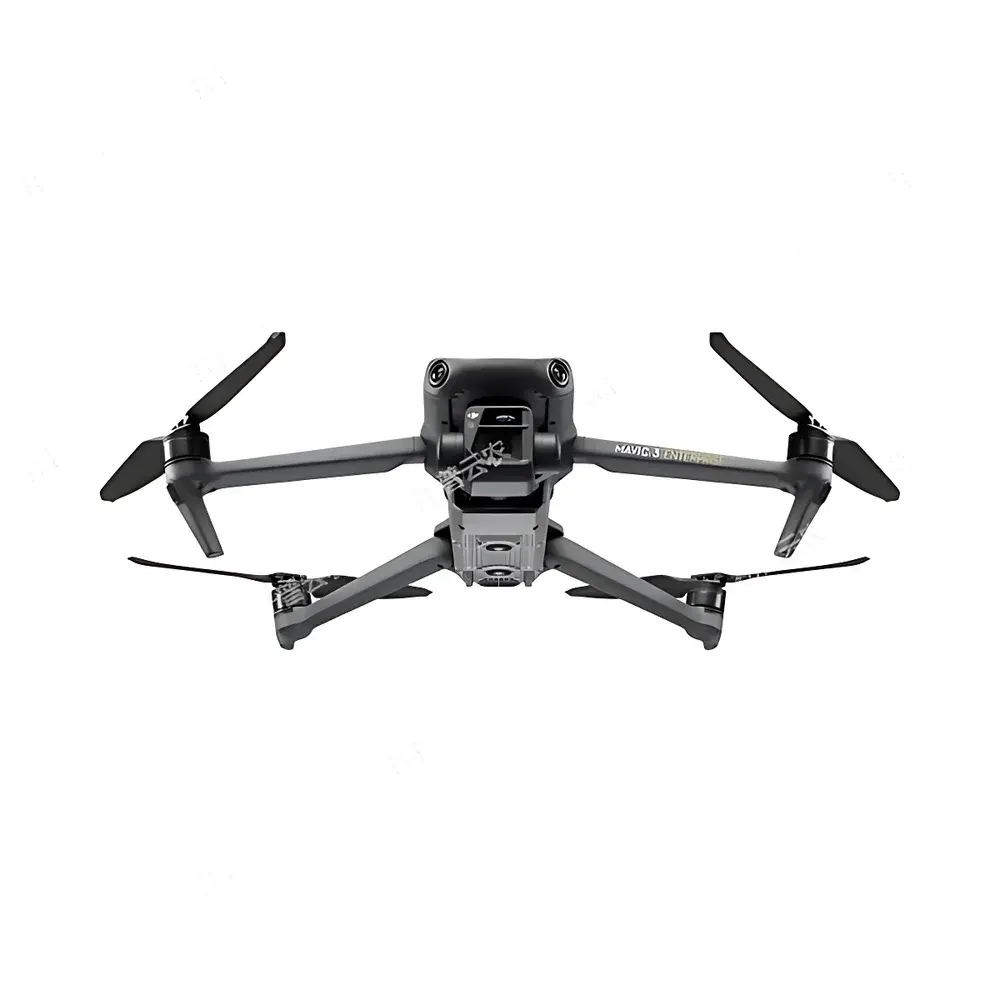
TopCloud-agri TP-DGP UAV-Based Multispectral Plant Phenotyping System
| Brand | TopCloud-agri |
|---|---|
| Origin | Zhejiang, China |
| Manufacturer Type | OEM Manufacturer |
| Country of Origin | China |
| Model | TP-DGP |
| Pricing | Upon Request |
Overview
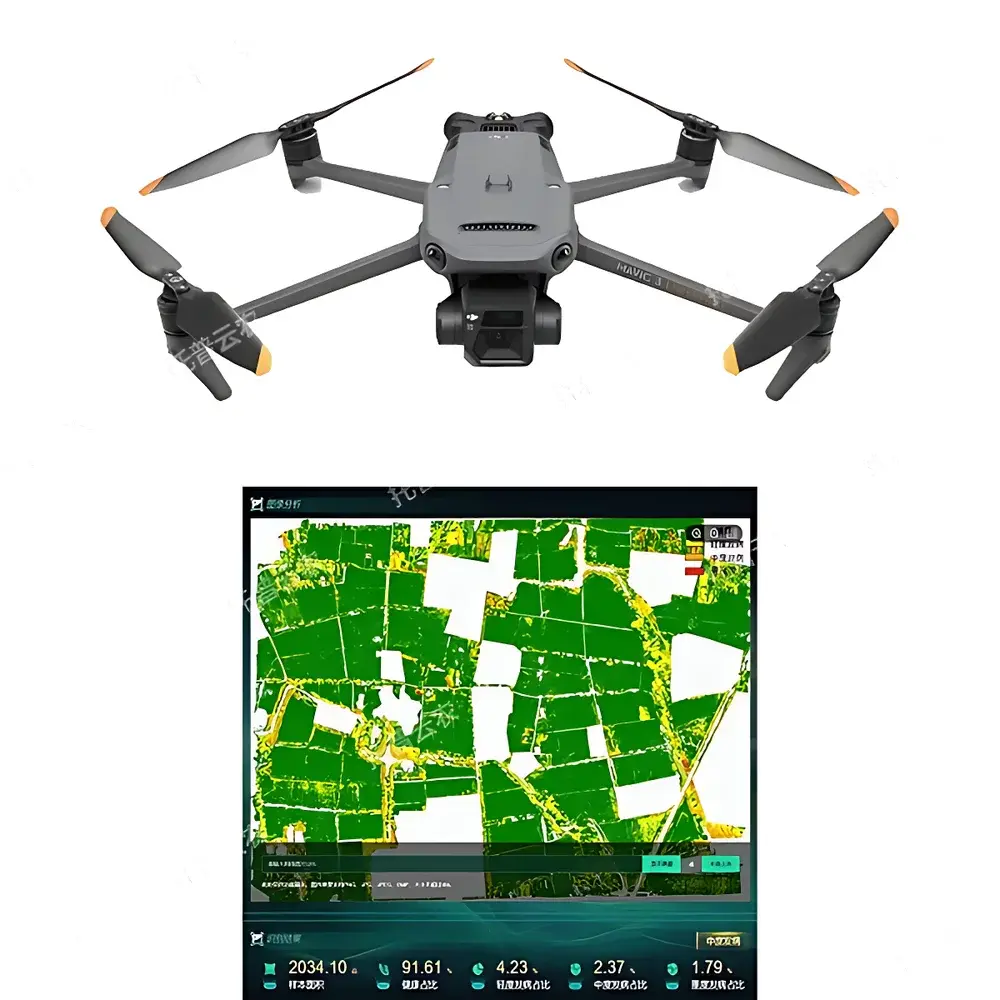
The TopCloud-agri TP-DGP UAV-Based Multispectral Plant Phenotyping System is an integrated remote sensing platform engineered for high-throughput, non-destructive field phenotyping in agricultural and plant science research. It leverages drone-mounted multispectral imaging combined with radiometrically calibrated spectral bands (Green, Red, Red Edge, and Near-Infrared) to capture spatially resolved canopy reflectance data at sub-decimeter ground sampling distance (GSD). The system operates on the physical principle of passive optical remote sensing—measuring solar-induced reflectance signatures across discrete wavebands—to derive biophysically meaningful vegetation indices (e.g., NDVI, NDRE, GNDVI, CIrededge) that correlate with chlorophyll content, leaf area index (LAI), water use efficiency, nitrogen status, and early-stage biotic/abiotic stress responses. Designed for deployment in open-field environments under natural illumination, it supports repeatable, time-series monitoring across multiple growth stages without physical contact or crop disturbance—enabling longitudinal studies compliant with FAO-recommended phenotyping protocols.
Key Features
- Autonomous flight mission planning with georeferenced waypoint navigation and adaptive altitude control for consistent GSD across heterogeneous terrain
- Integrated dual-sensor payload: 20-MP RGB camera (4/3″ CMOS, 24 mm equiv. focal length, DNG+JPEG output) and 5-MP multispectral imager (1/2.8″ CMOS, 25 mm equiv., 5-band spectral configuration)
- Real-time kinematic (RTK) GNSS positioning with centimeter-level absolute horizontal accuracy (1 cm + 1 ppm) and vertical accuracy (1.5 cm + 1 ppm)
- Machine learning–driven analytics engine supporting species-agnostic detection of emergence rate, canopy cover, plant height (via DSM generation), lodging severity, panicle/tassel count, and yield proxies
- Dedicated maize tassel localization module enabling automated spatial tagging for manual or robotic detasseling operations
- GIS-integrated web dashboard with interactive map layers, polygon-based field segmentation, and dynamic metadata tagging (soil type, cultivar, irrigation history, etc.)
- IoT device interoperability: native support for LoRaWAN/NB-IoT–enabled microclimate stations, soil moisture sensors, and EC/pH probes with synchronized timestamping and geospatial anchoring
- Photogrammetric processing pipeline incorporating bundle adjustment, orthorectification, radiometric calibration, and cloud-shadow masking to ensure pixel-level quantitative fidelity
- Self-supervised model refinement: manual annotation feedback loops trigger incremental retraining of detection models without requiring full dataset reprocessing
- Regulatory-compliant data export: structured CSV/Excel tables, georeferenced GeoTIFF rasters, publication-ready PNG/PDF visualizations, and audit-trail–enabled metadata logs
Sample Compatibility & Compliance
The TP-DGP system is validated for use across major cereal and row crops—including Oryza sativa (rice), Triticum aestivum (wheat), and Zea mays (maize)—under field conditions ranging from early vegetative to late reproductive stages. Its spectral bandpass design conforms to ISO 19705:2021 (Agricultural remote sensing — Spectral response requirements for vegetation monitoring) and aligns with USDA ARS standard protocols for multispectral field phenotyping. All photogrammetric outputs comply with ASPRS Positional Accuracy Standards for Digital Orthoimagery (2021), while RTK-derived coordinates meet NIST-traceable geodetic referencing requirements. Data management architecture supports GLP-aligned metadata retention (ISO/IEC 17025:2017 Annex A.3), including operator ID, sensor calibration certificates, flight log timestamps, and environmental condition logging (temperature, humidity, solar zenith angle).
Software & Data Management
The proprietary TopCloud Phenotype Analytics Suite provides a browser-based interface with role-based access control (RBAC), versioned project workspaces, and granular permission settings for collaborative research teams. All image processing workflows are containerized (Docker) and reproducible via SHA-256–hashed pipeline definitions. Raw data ingestion includes automatic EXIF parsing, radiometric gain normalization, and dark-frame subtraction. Vegetation index computation adheres to peer-reviewed algorithms published in Remote Sensing of Environment and Plant Phenomics. Export modules generate FAIR-compliant datasets (Findable, Accessible, Interoperable, Reusable) with embedded ISO 19115 metadata schemas. For regulated environments, optional 21 CFR Part 11–compliant electronic signature and audit trail modules are available upon request.
Applications
- Quantitative trait locus (QTL) mapping and genomic selection trials requiring high-temporal-resolution phenotypic data
- Field-scale validation of drought-tolerant or disease-resistant germplasm under real-world agronomic conditions
- Dynamic nitrogen management through RE-based chlorophyll estimation and variable-rate application prescription generation
- Pre-harvest yield forecasting using canopy structure metrics (height variance, green pixel density) and thermal–multispectral fusion
- Post-disaster damage assessment (e.g., hail, flood, frost) via change-detection analysis across multi-date orthomosaics
- Curriculum-integrated teaching modules for precision agriculture, remote sensing, and digital agronomy courses at undergraduate and graduate levels
- Smart farm advisory services delivering actionable insights via API-integrated decision support systems (DSS)
FAQ
What spectral bands does the multispectral camera capture, and are they factory-calibrated?
The sensor captures five discrete bands: Green (560 nm ±16 nm), Red (650 nm ±16 nm), Red Edge (730 nm ±16 nm), and Near-Infrared (860 nm ±26 nm), with radiometric calibration performed pre-shipment using NIST-traceable integrating sphere standards.
Can the system operate in partially cloudy conditions?
Yes—its onboard irradiance sensor enables real-time downwelling light correction, and the processing pipeline applies BRDF compensation to minimize directional reflectance artifacts caused by variable sun angles.
Is third-party software integration supported?
The system exposes RESTful APIs for bidirectional data exchange with platforms such as ArcGIS Enterprise, QGIS, RStudio (via ‘phenofit’ and ‘raster’ packages), and Python-based ML frameworks (TensorFlow, PyTorch).
How is geolocation accuracy maintained during long-range flights?
Dual-frequency RTK GNSS with PPK (Post-Processed Kinematic) fallback ensures sub-centimeter positional integrity; raw observation logs can be post-processed using Trimble Business Center or Emlid Studio for enhanced accuracy.
Does the platform support multi-season longitudinal analysis?
Yes—time-series orthomosaic stacks are automatically registered to a common coordinate reference system (CRS), enabling pixel-wise change detection and trend modeling across growing seasons with consistent geometric and radiometric normalization.
Related Products


