EcoTech PhenoTron®-SR High-Throughput Canopy and Root Phenotyping System
| Brand | EcoTech |
|---|---|
| Model | PhenoTron®-SR |
| Origin | Beijing, China |
| Imaging Modalities | Hyperspectral (400–1000 nm & 900–1700 nm), UV-MCF Fluorescence Hyperspectral, Chlorophyll Fluorescence Imaging (LEDIF & Full-Frame), Thermo-RGB Fusion |
| Spatial Resolution | Up to 1024 px (VIS-NIR), 640 px (SWIR), 20 MP RGB + 640×512 IR |
| Spectral Channels | 440 (VIS-NIR), 220 (SWIR) |
| Positioning Accuracy | ±1 mm (XYZ robotic stage) |
| Software | SpectrAPP, FluorVision, EcoTech GUI (touchscreen + PC client, wireless control) |
| Compliance | Designed for GLP-aligned plant phenotyping workflows |
| supports audit-ready metadata logging, protocol versioning, and ROI-based parameter export per ISO 20673 | 2019 (Plant Phenomics — Data Acquisition and Management Principles) |
Overview
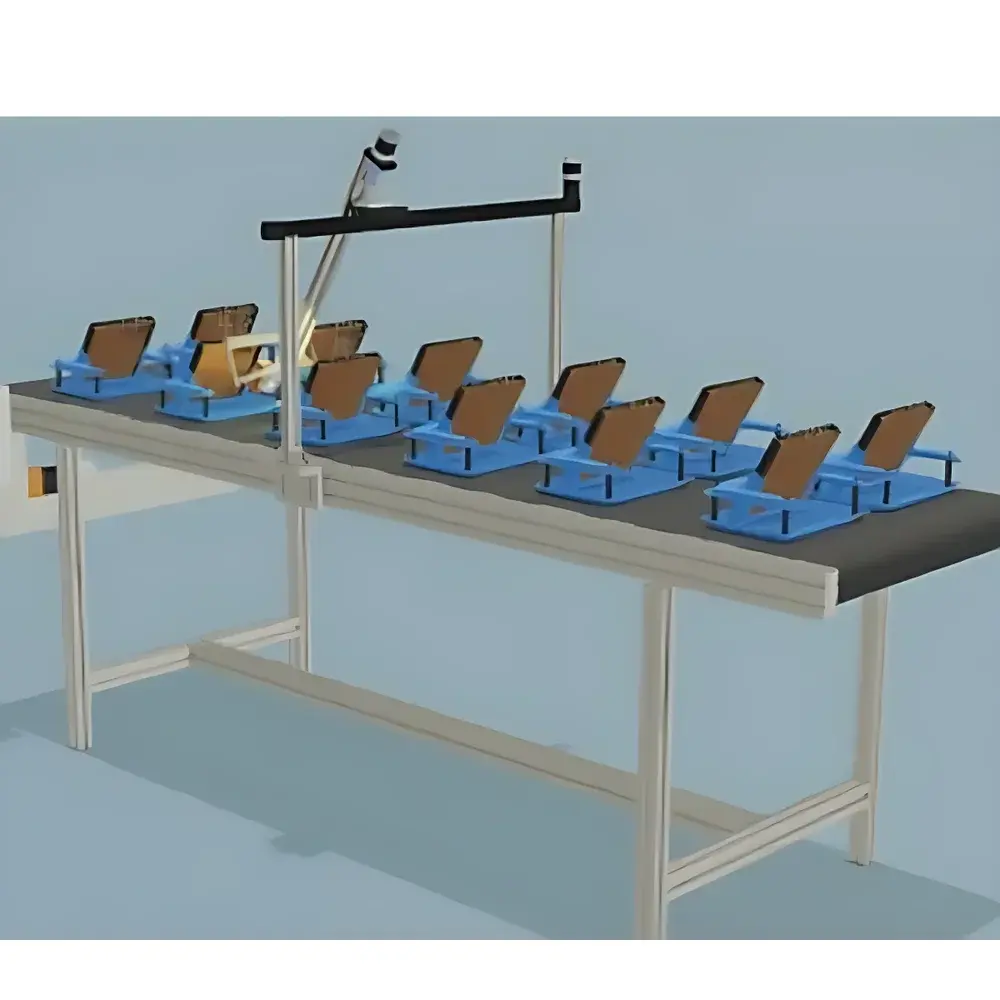
The EcoTech PhenoTron®-SR is an integrated, high-throughput phenotyping platform engineered for simultaneous, non-invasive quantification of aboveground and belowground plant traits under controlled or semi-controlled environments. It operates on the principle of multi-modal optical sensing—leveraging spatially registered hyperspectral imaging (HSI), chlorophyll fluorescence imaging (CFI), UV-induced multicolor fluorescence (UV-MCF), and thermo-RGB fusion—to extract quantitative morphological, physiological, and biochemical parameters across developmental stages. Unlike conventional single-sensor systems, the PhenoTron®-SR employs a synchronized XYZ robotic scanning architecture with sub-millimeter positioning repeatability, enabling pixel-accurate co-registration of datasets from disparate spectral domains. Its modular sensor bay accommodates interchangeable optical modules, allowing users to configure acquisition protocols for root window rhizotrons, vertical canopy towers, or conveyor-based seedling screening—each calibrated against traceable NIST-traceable reference standards for reflectance and temperature.
Key Features
- Tri-axial robotic gantry with ±1 mm positional accuracy and programmable scan trajectories for repeatable, geometry-consistent imaging across time-series experiments.
- Dual-range hyperspectral imaging: 400–1000 nm (440 bands, FWHM < 2.5 nm) and 900–1700 nm (220 bands, FWHM 8 nm), both supporting MROI (Multi-Region-of-Interest) spectral binning to minimize data volume without compromising index fidelity.
- UV-MCF fluorescence module capable of concurrent excitation at 365 nm and detection across blue (440 nm), green (520 nm), red (690 nm), and far-red (740 nm) emission bands—enabling spectral fingerprinting of secondary metabolites and photoprotective pigments.
- Thermo-RGB dual-lens system: 20-megapixel visible-light imager fused with uncooled microbolometer IR sensor (640 × 512 resolution), calibrated to ±2°C absolute accuracy across –20°C to 150°C, with optional high-temp range (0–550°C) for thermal stress assays.
- Integrated chlorophyll fluorescence imaging at 70 fps with full kinetic protocol support—including Kautsky induction curves, rapid light response (RLC), and NPQ relaxation kinetics—with real-time calculation of ΦPSII, Fv/Fm, Y(NO), and Rfd.
- Optional iPOT digital rhizobox system: Combines load-cell-based weight monitoring (0.1 g resolution), capacitance soil moisture probes (0–100% VWC), thermistors (±0.2°C), stem flow sensors, and leaf temperature thermography—synchronized with optical acquisitions via TTL triggers.
Sample Compatibility & Compliance
The PhenoTron®-SR supports diverse experimental configurations: transparent root observation chambers (up to 60 cm depth), vertical growth towers (max height 2.2 m), and conveyor-mounted seedling trays (throughput > 500 plants/hour). All optical modules are factory-aligned to a common coordinate frame referenced to ISO 11452-2 mechanical datum points. Data acquisition complies with FAIR principles (Findable, Accessible, Interoperable, Reusable) and embeds MIAPPE-compliant metadata (Minimum Information About a Plant Phenotyping Experiment). While not certified for GMP manufacturing, its software architecture supports 21 CFR Part 11–compliant audit trails when deployed with validated network authentication, electronic signatures, and immutable protocol logs—making it suitable for pre-breeding trials under GLP conditions per OECD TG 111 and ISO/IEC 17025:2017 Annex A.
Software & Data Management
SpectrAPP and FluorVision constitute the core analytical suite—both built on Qt/C++ with Python API hooks for custom algorithm integration. SpectrAPP enables batch processing of hyperspectral cubes with automated atmospheric correction (using empirical line method), spectral library matching (USDA Plant Stress Library v3.1), and index computation across 90+ published vegetation indices—including NDVI, PRI, CCI, NDNI, and stress-specific metrics such as NPQI and CTRI. FluorVision provides kinetic modeling of fluorescence decay curves using mono- and bi-exponential fitting, plus spatial mapping of quenching coefficients (qP, qN) derived from pulse-amplitude modulated (PAM) sequences. Both applications support ROI-based statistical reporting (mean, SD, CV%), histogram normalization, and export to HDF5, NetCDF4, or MIAPPE-compliant JSON-LD schemas. Raw data is stored in vendor-neutral formats with embedded EXIF-like headers containing timestamp, stage coordinates, exposure settings, and sensor calibration coefficients.
Applications
- Root architecture phenotyping: Quantification of lateral root density, tip count, branching angle, and gravitropic response under nutrient or drought gradients—correlated with SWIR-derived soil organic carbon maps.
- Crop abiotic stress screening: Time-resolved thermal heterogeneity analysis coupled with PRI and ∆PRI to detect early stomatal closure preceding visible wilting.
- Seedling vigor assessment: Multispectral texture analysis (GLCM entropy, contrast) combined with chlorophyll fluorescence yield (Fv/Fm) to predict field emergence success.
- Secondary metabolite profiling: UV-MCF spectral unmixing to resolve anthocyanin vs. flavonol contributions in berry skins or leaf epidermis under UV-B treatment.
- Phenological staging: NIRv (Near-Infrared Reflectance Vegetation Index) and CCI (Canopy Chlorophyll Content Index) time-series to model developmental transitions in perennial woody species.
- Genome-wide association studies (GWAS): High-fidelity trait extraction for QTL mapping—e.g., root-to-shoot ratio derived from co-registered HSI and thermal segmentation masks.
FAQ
Does the PhenoTron®-SR support fully automated daily imaging schedules?
Yes. The embedded controller accepts cron-style scheduling and integrates with external environmental controllers (e.g., climate chambers) via Modbus TCP or RS-485 to trigger acquisitions based on diurnal cycles or sensor thresholds.
Can spectral data be exported for third-party machine learning pipelines?
Absolutely. Hyperspectral cubes are exported as ENVI .hdr/.bin or HDF5 with georeferenced coordinate arrays; FluorVision outputs kinetic parameters as CSV with timestamped metadata columns compatible with scikit-learn or TensorFlow input pipelines.
Is remote maintenance and software update supported?
The system includes SSH-accessible Linux backend (Ubuntu LTS) with signed firmware updates delivered via secure HTTPS repository; remote diagnostics require prior TLS-authenticated VPN enrollment.
What calibration standards are supplied with the system?
Each shipment includes NIST-traceable Spectralon® diffuse reflectance panels (2%, 50%, 99%), blackbody source for IR calibration (–10°C to 80°C), and fluorescence reference slides (rhodamine B, chlorophyll a solution) with certified quantum yields.
How is data provenance ensured across multi-user deployments?
User sessions are isolated via Linux cgroups; all acquisitions append SHA-256 hashes of raw frames to SQLite audit logs, and protocol versions are Git-managed with commit-tagged configuration snapshots.


