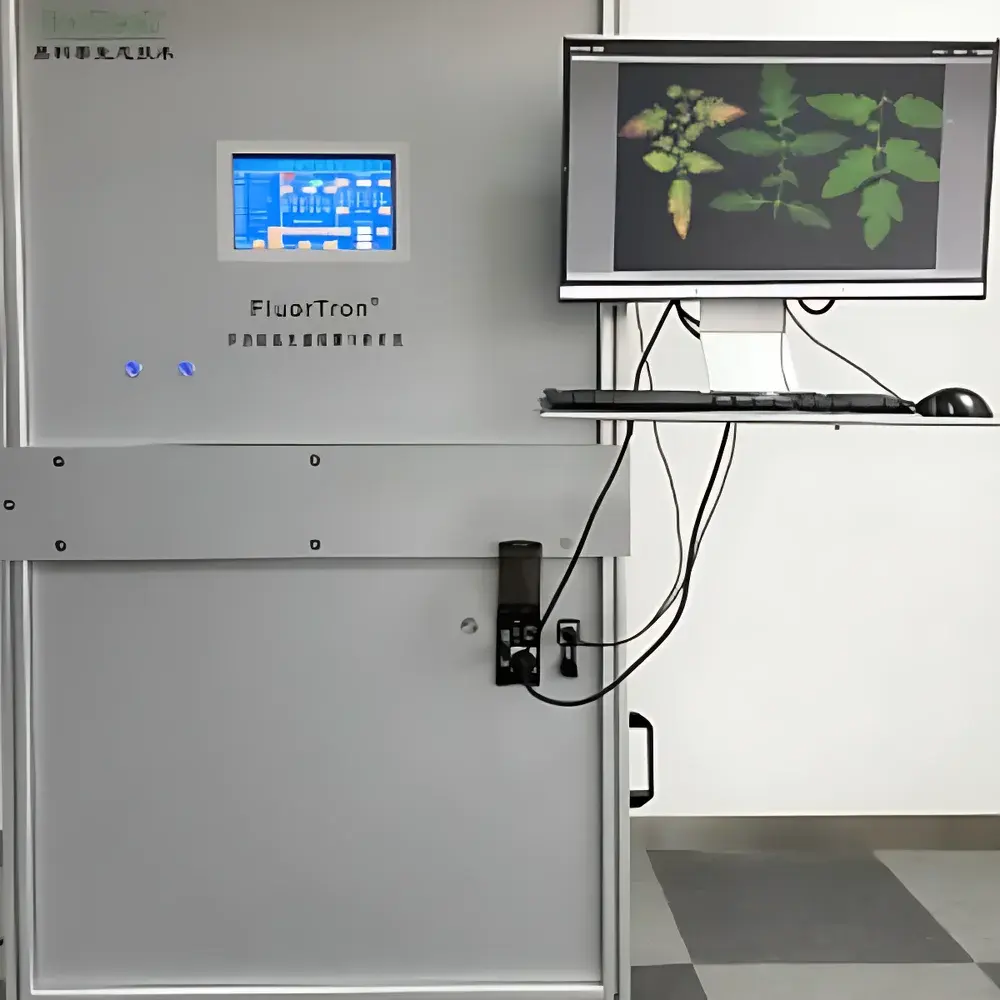
EcoTech FluorTron® Multispectral Fluorescence Imaging & Hyperspectral Analysis System
| Brand | EcoTech |
|---|---|
| Model | FluorTron® |
| Excitation Sources | UV (365 nm), Blue (450 nm), Green (520 nm), Red (630 nm) |
| Emission Range | 400–1000 nm (standard), optional 900–1700 nm SWIR module |
| Spectral Resolution | ≤ 2.5 nm (VIS-NIR), ≤ 5 nm (SWIR) |
| Spatial Resolution | Up to 1.2 MP per frame, pixel size adjustable via lens selection |
| Imaging Modes | Chlorophyll Fluorescence Imaging (F690/F740), UV-MCF Multicolor Fluorescence Imaging (F440/F520/F690/F740), Reflectance Hyperspectral Imaging, Bioluminescence/GFP Imaging (optional), Temperature-Controlled Imaging (optional) |
| Software | FluorVision v4.2 + SpectrAPP v3.1 |
| Compliance | ASTM E2981-22 (Fluorescence Imaging for Plant Stress Assessment), ISO 17123-9 (Optical Remote Sensing of Vegetation), GLP-compliant audit trail, FDA 21 CFR Part 11 ready (electronic signature & data integrity modules) |
Overview
The EcoTech FluorTron® Multispectral Fluorescence Imaging & Hyperspectral Analysis System is an integrated benchtop platform engineered for non-invasive, quantitative, and spatially resolved analysis of biological fluorescence and reflectance signatures across living plant tissues, algae, seeds, and medicinal botanicals. It operates on the physical principles of photoluminescence excitation and spectral dispersion—leveraging controlled narrowband illumination (UV, blue, green, red) to induce characteristic fluorescence emissions from endogenous fluorophores (e.g., chlorophyll a, phenolic compounds, flavonoids, coumarins) and exogenous reporters (e.g., GFP, luciferase). Simultaneously, it captures high-fidelity hyperspectral reflectance data (400–1000 nm standard; 900–1700 nm optional) to derive biochemical and biophysical parameters via spectral unmixing and chemometric modeling. Unlike conventional fluorescence imagers limited to single-band detection, FluorTron® delivers full spectral fingerprints at each pixel—enabling rigorous separation of overlapping emission bands (e.g., F440, F520, F690, F740) and precise quantification of ratiometric indices critical for physiological interpretation.
Key Features
- Multimodal excitation architecture supporting UV (365 nm), blue (450 nm), green (520 nm), and red (630 nm) LEDs with independent intensity control and temporal synchronization—optimized for chlorophyll fluorescence induction, UV-MCF (Multicolor Fluorescence) profiling, and pigment-specific index derivation.
- High-throughput push-broom hyperspectral imaging with <1.5 nm spectral sampling interval in VIS-NIR (400–1000 nm), enabling robust spectral deconvolution of overlapping fluorophore emissions and reflectance features.
- Integrated dual-path optical design: one path dedicated to fluorescence imaging under dark-adapted or actinic conditions; the other for calibrated reflectance capture using onboard reference panel and NIST-traceable irradiance calibration.
- Modular hardware expansion: optional temperature-controlled imaging chamber (5–40 °C, ±0.2 °C stability) and motorized stage for time-series phenotyping; optional SWIR module (900–1700 nm) for water status and lignin/cellulose mapping.
- Embedded Linux-based real-time acquisition system with 10.1″ capacitive touchscreen interface and remote operation via Ethernet/WiFi—supporting scheduled autonomous runs, script-driven protocols, and IoT-enabled fleet management.
- Machine vision pipeline incorporating convolutional neural networks (CNNs) for automated ROI segmentation (e.g., leaf lamina vs. veins, seed coat vs. embryo), background subtraction, and real-time index computation (e.g., NPQI, PRI, NDVI705).
Sample Compatibility & Compliance
FluorTron® accommodates diverse biological specimens without sample preparation: intact leaves (dicot/monocot), seedlings, detached roots, whole seeds (cereal, legume, medicinal), algal biofilms, and dried herbal slices. Its non-contact, low-photon-flux illumination ensures minimal photodamage during repeated measurements—validated per ISO 17123-9 for long-term viability monitoring. The system complies with ASTM E2981-22 for standardized fluorescence-based stress phenotyping and supports GLP/GMP workflows through FluorVision’s electronic audit trail, user access controls, and 21 CFR Part 11–compliant electronic signatures. All spectral libraries (e.g., reference spectra for ginsenosides, rosmarinic acid, chlorogenic acid) are stored with metadata traceability per FAIR principles.
Software & Data Management
FluorVision v4.2 provides core fluorescence analysis: kinetic curve fitting (OJIP transients), spatial mapping of Fv/Fm, ΦPSII, NPQ, and ratiometric indices (Fb/Fg, Fr/Ffr, F735/F700); SpectrAPP v3.1 handles hyperspectral processing—PLSR and PCA regression modeling, spectral angle mapper (SAM) classification, and vegetation index automation (NDVI, PSRI, CRI1, ARI2, WBIR). Both platforms support HDF5-based data storage, batch processing of >500 samples/hour, and export to MATLAB/Python for custom algorithm integration. Raw data retain full wavelength-pixel-intensity cubes (x × y × λ), ensuring reproducibility and third-party validation readiness.
Applications
- Plant phenomics: High-resolution spatiotemporal mapping of photosynthetic efficiency, drought-induced photoinhibition, herbicide mode-of-action (e.g., diuron-induced Fv/Fm decline), and early biotic stress signatures (e.g., fungal elicitor-triggered flavonoid accumulation).
- Seed science: Dual-mode fingerprinting—reflectance spectral signatures (400–1000 nm) for moisture, protein, starch; fluorescence signatures (UV-MCF) for viability markers (NAD(P)H, riboflavin) and aging-related oxidative products.
- Medicinal botany: Discrimination of authentic Panax ginseng vs. adulterants via combined chlorophyll fluorescence decay kinetics and ginsenoside-specific UV-excited fluorescence peaks at 460 nm and 520 nm.
- Crop breeding: Rapid screening of elite lines for nitrogen use efficiency (NBI index), anthocyanin accumulation (ARI2), or heat tolerance (F690/F740 thermal quenching ratio).
- Postharvest physiology: Quantifying senescence progression in leafy greens via PRI and PSRI dynamics correlated with chlorophyll degradation and carotenoid oxidation.
FAQ
What spectral ranges are covered by the standard FluorTron® configuration?
The base system acquires fluorescence and reflectance data from 400 to 1000 nm at ≤2.5 nm resolution. An optional SWIR extension (900–1700 nm) enables water content and structural carbohydrate analysis.
Can FluorTron® distinguish between different flavonoid classes in planta?
Yes—via UV-MCF imaging combined with spectral unmixing: quercetin derivatives emit at ~520 nm, anthocyanins peak at ~680 nm under green excitation, and hydroxycinnamic acids (e.g., ferulic acid) show strong blue fluorescence (~440 nm) under UV.
Is the system compatible with long-term time-lapse experiments?
Yes—programmable illumination sequences, thermal stabilization (optional chamber), and automated focus maintenance allow unattended 72+ hour kinetic studies under controlled environmental conditions.
How does FluorTron® ensure data comparability across laboratories?
Through factory-calibrated radiometric and spectral response functions, NIST-traceable reference standards, and export of raw hyperspectral cubes with embedded calibration metadata per IEEE Std 1857.2.
Does FluorVision support statistical modeling for predictive diagnostics?
Yes—it integrates PLSR, SVM, and random forest modules trained on validated ground-truth datasets (e.g., pathogen load, nutrient concentration) to generate deployable classification/regression models with cross-validated R² and RMSE metrics.
Related Products


