Dantec Dynamics Q-400 Digital Image Correlation (DIC) Strain Measurement System
| Brand | Dantec Dynamics |
|---|---|
| Origin | Germany |
| Model | Q-400 |
| Measurement Dimensions | 2D & 3D |
| Measurable Area | 10 mm × 10 mm to 5 m × 5 m |
| Displacement Resolution | 1 µm |
| Strain Resolution | 0.005% |
| Compliance | ISO/IEC 17025-aligned calibration traceable to PTB (Physikalisch-Technische Bundesanstalt) |
Overview
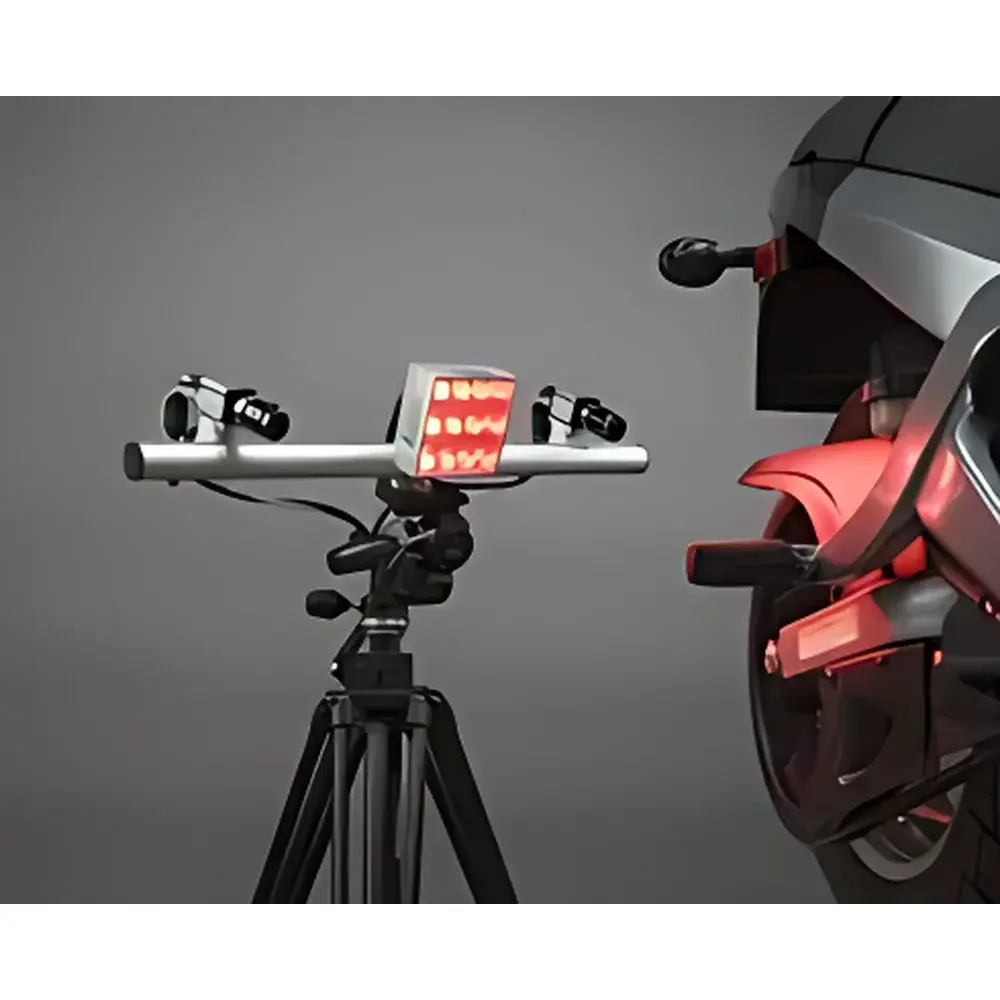
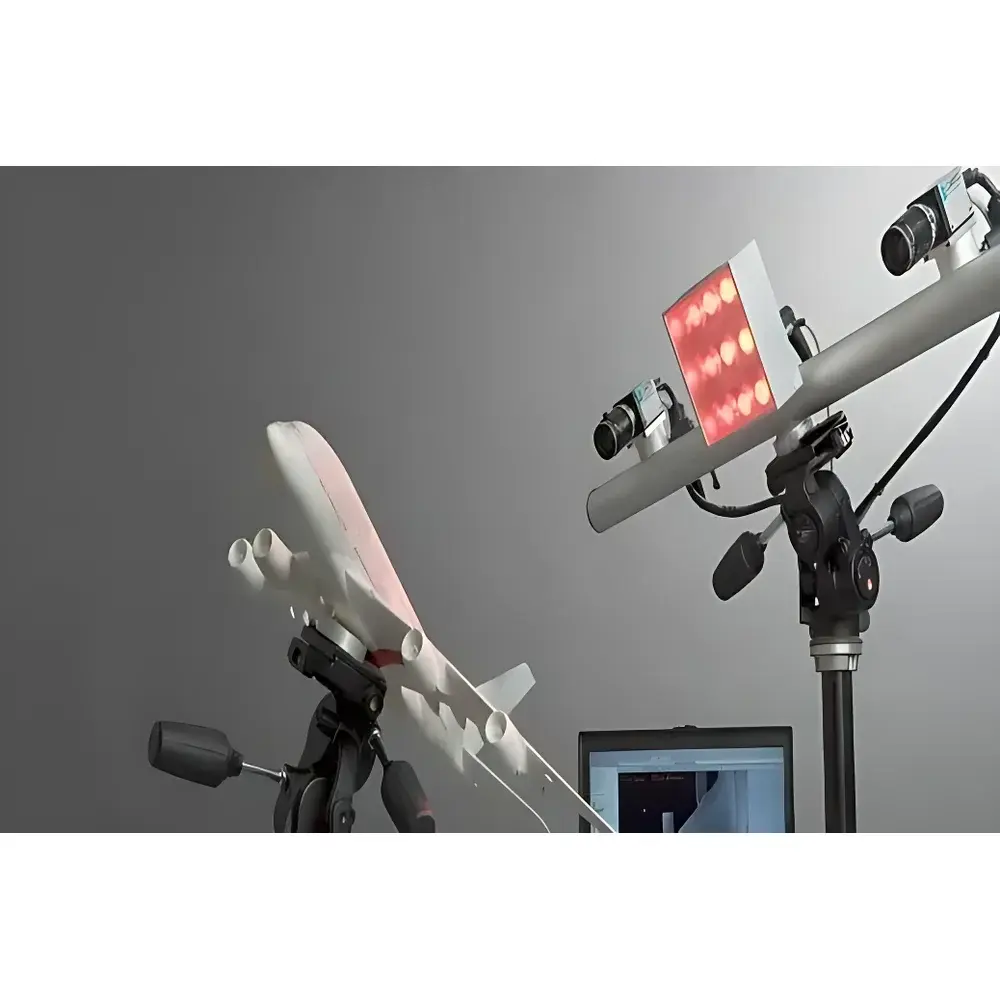
The Dantec Dynamics Q-400 Digital Image Correlation (DIC) Strain Measurement System is a high-precision, non-contact optical metrology platform engineered for full-field displacement and strain quantification on material surfaces under static or dynamic loading conditions. Based on stereo-vision photogrammetry and sub-pixel intensity correlation algorithms, the Q-400 captures synchronized images from two calibrated high-resolution CMOS cameras to reconstruct surface topology and compute deformation gradients across the entire field of view. Unlike contact-based extensometers or strain gauges, DIC eliminates mechanical interference, thermal coupling, and boundary condition perturbations—making it especially suitable for brittle materials, soft tissues, composites, additive-manufactured parts, and thermally sensitive specimens. The system operates on the principle of tracking statistically unique surface patterns (speckle patterns), either naturally occurring or artificially applied, to solve for in-plane and out-of-plane displacements via iterative cross-correlation of digital image subsets. This enables direct computation of engineering strain tensors (εxx, εyy, γxy) and principal strain components without assumptions about material behavior or stress state.
Key Features
- True dual-camera stereo-DIC architecture supporting both 2D in-plane and 3D full-field measurement modes
- Configurable spatial resolution: scalable measurement area from 10 mm × 10 mm (micro-scale) up to 5 m × 5 m (structural-scale), with consistent sub-pixel registration accuracy
- Displacement resolution down to 1 µm at optimal magnification and lighting conditions; strain resolution of 0.005% (50 µε) validated per ASTM E837-22 Annex A4 guidelines
- Real-time acquisition and post-processing engine compatible with frame rates up to 1000 Hz (dependent on ROI and camera configuration)
- Integrated LED illumination modules with adjustable intensity and uniformity control to minimize specular reflection and shadow artifacts
- Ruggedized aluminum optical bench with kinematic mounting interfaces for repeatable camera alignment and thermal stability
- Factory-calibrated lens-camera systems traceable to PTB standards, with optional NIST-traceable verification reports available upon request
Sample Compatibility & Compliance
The Q-400 imposes no intrinsic material limitations: it has been successfully deployed on metals, polymers, ceramics, biological tissues, foams, textiles, and coated substrates. Surface preparation requires only a stochastic speckle pattern—achievable via matte spray, inkjet printing, or laser ablation—with contrast ratio >3:1 recommended. The system complies with metrological best practices defined in ISO/IEC 17025:2017 for testing laboratories, and supports audit-ready documentation required under GLP and GMP environments. All calibration certificates include uncertainty budgets compliant with GUM (Guide to the Expression of Uncertainty in Measurement). For regulated industries—including aerospace (AS9100), biomedical device development (ISO 13485), and automotive R&D (VDA 5)—the Q-400 can be configured with 21 CFR Part 11-compliant software modules featuring electronic signatures, audit trails, and role-based access control.
Software & Data Management
I-View X software (v6.3+) serves as the unified interface for hardware control, real-time preview, calibration validation, and quantitative analysis. It provides automated calibration routines including bundle adjustment, epipolar geometry correction, and lens distortion modeling. Post-processing includes temporal filtering, strain smoothing via Gaussian convolution kernels, vector field visualization (displacement arrows, strain contour overlays), and export of ASCII, HDF5, or MATLAB-compatible .mat files. Batch processing workflows support automated report generation aligned with internal SOPs or external standards such as ASTM E1338 or ISO/TS 11462. Raw image datasets are stored in lossless TIFF format with embedded EXIF metadata (timestamp, exposure, lens ID, calibration ID), ensuring full traceability throughout the data lifecycle.
Applications
- Mechanical testing labs: tensile/compression/fatigue testing with synchronized load-cell and DIC data fusion
- Composite material characterization: interlaminar shear, delamination onset, and fiber-matrix interface strain transfer
- Microelectronics reliability: warpage analysis of PCBs, solder joint strain mapping during thermal cycling
- Biomaterial mechanics: cartilage deformation, arterial wall strain under pulsatile pressure, scaffold mechanical integrity assessment
- Additive manufacturing QA: residual stress evaluation, distortion monitoring during build, post-process heat treatment validation
- Structural health monitoring: crack tip opening displacement (CTOD), fatigue crack growth tracking, bolted joint slip quantification
FAQ
What surface preparation is required for reliable DIC measurements?
A high-contrast, random speckle pattern with feature sizes between 2–5 pixels is recommended. Matte white spray paint combined with black ink dots or controlled laser texturing yields optimal correlation stability.
Can the Q-400 measure high-speed transient events?
Yes—when equipped with high-frame-rate cameras (e.g., Phantom v2512) and synchronized strobe lighting, the system supports dynamic event capture at up to 1 MHz equivalent temporal resolution using sub-framing techniques.
Is third-party integration supported?
The Q-400 exposes a documented TCP/IP API and LabVIEW/VBA SDK for bidirectional communication with MTS, Instron, or custom test rigs, enabling closed-loop feedback control and synchronized trigger management.
How is measurement uncertainty quantified and reported?
Uncertainty is calculated per GUM principles using Type A (statistical repeatability) and Type B (calibration certificate, pixel size, lens distortion) components. Full uncertainty budgets are generated automatically within I-View X and included in PDF reports.
Does the system support temperature-controlled environments?
Yes—optional environmental enclosures with viewport-integrated heating/cooling stages and thermal drift compensation algorithms maintain measurement fidelity from −40 °C to +150 °C.


