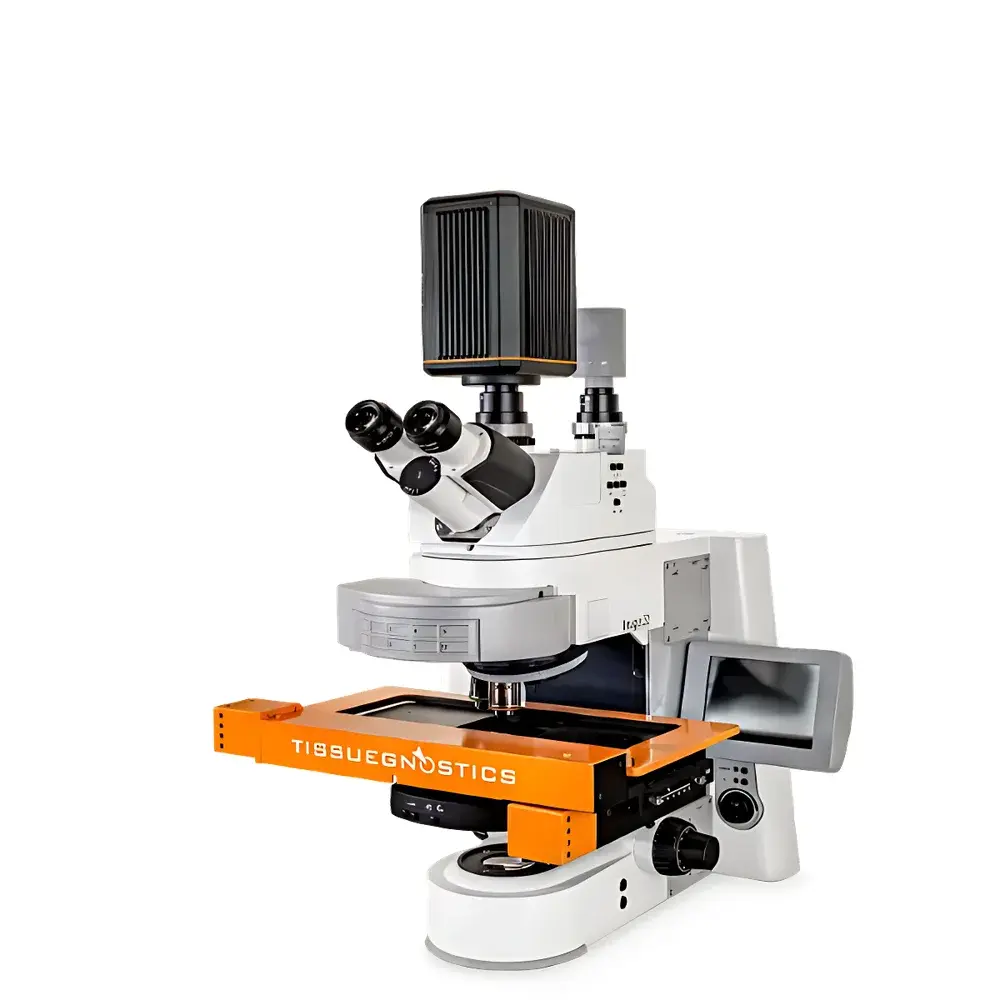
TissueGnostics TISSUEFAXS SPECTRA Full-Spectrum In Situ Single-Cell Spatial Phenotyping and Quantification System
| Brand | TissueGnostics |
|---|---|
| Origin | Austria |
| Manufacturer Type | Original Equipment Manufacturer (OEM) |
| Import Status | Imported |
| Model | TISSUEFAXS SPECTRA |
| Price Range | USD 420,000 – 700,000 |
Overview
The TissueGnostics TISSUEFAXS SPECTRA is a full-spectrum, high-resolution automated fluorescence imaging and quantitative pathology platform engineered for in situ single-cell spatial phenotyping within intact tissue sections. It employs continuous spectral acquisition across the visible and near-visible range (typically 400–720 nm at 2–5 nm resolution), enabling unmixing of ≥11 fluorescent labels—including primary antibodies conjugated to conventional dyes (e.g., Alexa Fluor 488, Cy3, Cy5), quantum dots, and endogenous fluorophores—without physical filter wheel changes. Unlike conventional multi-channel epifluorescence or confocal systems constrained by spectral overlap and fixed bandpass detection, the SPECTRA system acquires raw spectral stacks per pixel and applies linear unmixing algorithms based on reference spectra, effectively separating co-localized signals and suppressing autofluorescence from collagen, elastin, red blood cells, or lipofuscin. This principle—grounded in hyperspectral imaging physics and constrained non-negative matrix factorization (cNMF)—ensures quantitative fidelity in complex, densely labeled human or murine tissue specimens, supporting rigorous spatial biology workflows compliant with emerging standards in digital spatial profiling.
Key Features
- Full-spectrum acquisition mode: Continuous spectral scanning from 400 nm to 720 nm with configurable spectral sampling intervals (2 nm, 5 nm, or 10 nm step size)
- ≥11-color multiplex capability: Supports simultaneous detection and unmixing of 10+1 immunofluorescent markers plus DAPI, with user-defined reference spectra libraries
- Autofluorescence suppression: Integrated spectral unmixing algorithm removes tissue-intrinsic fluorescence contributions without requiring chemical quenching or hardware-based subtraction
- AI-powered tissue compartment classification: Deep learning-based Classifier module automatically segments tumor epithelium, stroma, vasculature, glands, bronchioles, and necrotic regions using morphological and intensity-based features
- Single-cell spatial phenotyping engine: Performs subcellular localization-aware segmentation, extracting >30 quantitative descriptors per cell—including integrated fluorescence intensity, nuclear/cytoplasmic ratio, shape metrics (circularity, solidity), and spatial coordinates (x, y, z)
- Real-time spectral validation: On-the-fly preview of raw per-pixel spectra and unmixing residuals to verify decomposition accuracy prior to batch analysis
- Multi-scale spatial analysis: Enables distance-based metrics (e.g., nearest-neighbor distances, Ripley’s K-function, Voronoi tessellation) between phenotypically defined cell populations at micron-level precision
Sample Compatibility & Compliance
The TISSUEFAXS SPECTRA accommodates standard FFPE and frozen tissue sections (4–10 µm thickness) mounted on standard glass slides, including charged, APES-coated, or PEN-membrane slides for LCM compatibility. It supports common mounting media (e.g., ProLong Diamond, Vectashield) and is validated for use with tyramide signal amplification (TSA), enzymatic antigen retrieval, and sequential immunolabeling protocols. All image acquisition, processing, and reporting modules comply with ISO 13485:2016 (medical device quality management) and support audit trail generation per FDA 21 CFR Part 11 requirements when deployed in regulated environments. Data export formats include OME-TIFF (with embedded metadata), CSV (cell-level features), GeoJSON (spatial annotations), and FCS-like files for downstream flow cytometry-style gating in third-party tools (e.g., FlowJo, Cytobank).
Software & Data Management
The system runs on StrataQuest v8.x software—a modular, scriptable analysis suite built on Qt/C++ with Python API extension support. Core modules include Spectral Unmixing Studio, Tissue Classifier Builder, Cell Phenotype Gating Workspace, and Spatial Interaction Analyzer. All processing pipelines are fully reproducible: users define parameter sets (e.g., segmentation thresholds, unmixing references, gate coordinates), save them as XML-based protocol files, and reapply them across batches. Raw spectral data and processed results are stored in a relational SQLite database with time-stamped versioning. For enterprise deployment, optional integration with DICOM-SR (Structured Reporting) and PACS via HL7/FHIR adapters is available. Audit logs record operator ID, timestamp, parameter modifications, and export events—enabling GLP/GMP-compliant documentation for preclinical biomarker studies.
Applications
The platform is routinely applied in translational immuno-oncology research, particularly for characterizing tumor microenvironment (TME) architecture in colorectal, hepatocellular, and lung carcinomas. Published use cases include quantifying CD4+/CD8+/FOXP3+/PD-1+ lymphocyte infiltration gradients across tumor–stroma interfaces; mapping spatial co-expression of PD-L1, HLA-DR, and CD68 in macrophage subsets; and correlating epithelial–immune cell proximity with clinical response to checkpoint inhibitors. Beyond oncology, it supports neuroinflammatory studies (e.g., microglia–astrocyte interactions in Alzheimer’s tissue), renal fibrosis staging (collagen deposition + immune cell density mapping), and developmental biology (spatial patterning of transcription factor expression in embryonic sections). Its ability to generate “tissue cytometry” datasets—i.e., single-cell feature matrices with native spatial context—makes it interoperable with spatial transcriptomics alignment tools (e.g., Seurat, Squidpy) and essential for hypothesis generation in spatial multi-omics projects.
FAQ
What spectral resolution and range does the TISSUEFAXS SPECTRA support?
It captures continuous spectra from 400 nm to 720 nm with selectable sampling intervals of 2 nm, 5 nm, or 10 nm, balancing spectral fidelity and acquisition speed.
Can the system quantify endogenous fluorophores such as NAD(P)H or FAD?
Yes—its full-spectrum acquisition enables identification and separation of intrinsic metabolic fluorophores when combined with appropriate excitation sources and reference spectral libraries.
Is spectral unmixing performed in real time or post-acquisition?
Unmixing is performed post-acquisition using CPU/GPU-accelerated algorithms; however, real-time spectral preview and residual visualization allow immediate quality assessment during acquisition.
Does StrataQuest support batch processing of multiple slides with identical protocols?
Yes—protocols are saved as portable XML files and can be applied across hundreds of slides with automated QC flagging for focus drift, staining variability, or spectral artifacts.
How is spatial relationship data exported for statistical modeling?
Distance matrices, neighborhood graphs, and spatial point pattern statistics are exportable as CSV or HDF5, compatible with R (spatstat), Python (scikit-learn, squidpy), and MATLAB toolboxes.