SPL-Micro2000 Stand-Alone Ruby Fluorescence & Raman Pressure Calibration System
| Brand | SPL Photonics |
|---|---|
| Origin | Zhejiang, China |
| Model | SPL-Micro2000 |
| Excitation Wavelengths | 405 nm, 450 nm, 520 nm, 532 nm |
| Pressure Range (RT) | 0–100 GPa |
| Pressure Resolution | 0.1 GPa |
| Objective Lenses | 10× / 20× (WD: 29–34 mm) |
| CCD | 1/2″ CMOS, 2048 × 1536 (3 MP), color |
| Spectral Range (Fluorescence/Raman Mode) | 400–1100 nm |
| Switching Mechanism | Manual lever for fluorescence ↔ Raman mode selection |
| Software | Integrated spectral & CCD acquisition |
| dual-pressure calibration algorithms (P < 20 GPa | P = 2.74(λ − λ₀) |
| P > 20 GPa | P = 3.808[(1 + (λ − λ₀)/λ₀)⁵ − 1]) |
Overview
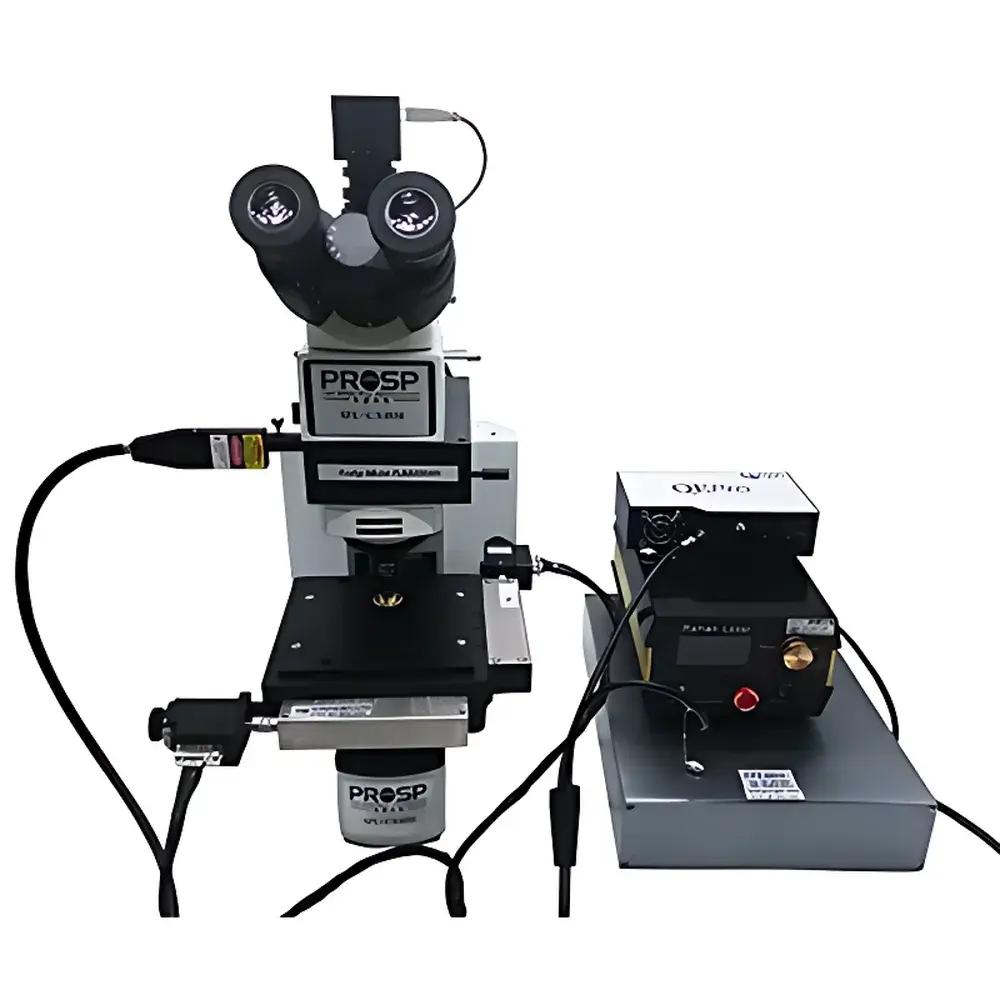
The SPL-Micro2000 Stand-Alone Ruby Fluorescence & Raman Pressure Calibration System is a vertically configured, microscope-integrated optical instrumentation platform engineered for high-precision in situ pressure determination in diamond anvil cell (DAC) experiments and other high-pressure research environments. It operates on the well-established ruby fluorescence pressure scale, leveraging the hydrostatic pressure-induced shift of the R₁ emission line (originally at 694.3 nm under ambient conditions) in synthetic ruby (Al₂O₃:Cr³⁺). This shift—linear below ~20 GPa and governed by a fifth-order Birch–Murnaghan equation of state above—is quantitatively correlated to pressure via rigorously validated empirical calibrations traceable to primary standards. Unlike fixed-optics or fiber-coupled benchtop systems, the SPL-Micro2000 integrates directly with commercially available upright microscopes, enabling simultaneous optical imaging, spatially resolved spectroscopy, and real-time pressure mapping without mechanical reconfiguration. Its modular architecture supports both ruby fluorescence thermobarometry and micro-Raman spectroscopy (with optional 785 nm excitation), making it suitable for correlative structural, vibrational, and thermodynamic analysis in condensed matter physics, geophysics, and materials science laboratories.
Key Features
- Vertical microscope-integrated design compatible with standard upright optical platforms (e.g., Olympus BX series, Zeiss Axio Imager)
- Dual-mode operation: manual lever-actuated switching between ruby fluorescence pressure calibration and micro-Raman spectroscopy
- Multi-wavelength excitation flexibility: supports 405 nm, 450 nm, 520 nm, and 532 nm lasers—enabling optimization for signal-to-noise ratio, photoluminescence background suppression, and thermal load management
- Broad spectral coverage: 400–1100 nm detection range accommodates both visible fluorescence and near-infrared Raman shifts
- High-spatial-resolution capability: equipped with 10× and 20× long-working-distance objectives (WD: 29–34 mm), optimized for DAC sample chambers and thick optical windows
- Integrated acquisition software with real-time R₁ peak identification, user-defined λ₀ input, and automatic pressure computation using ISO-aligned calibration equations
- 3-megapixel color CMOS detector (2048 × 1536) for simultaneous spectral and morphological data capture
Sample Compatibility & Compliance
The SPL-Micro2000 is designed for use with diamond anvil cells, sapphire anvils, and other transparent high-pressure vessels where optical access is maintained along the incident and collection axes. It accommodates standard DAC geometries (e.g., 300 µm culet, 16:1 gasket thickness-to-diameter ratio) and supports cryogenic stages (down to 4 K) and resistive heating modules when integrated with compatible microscope stages. While not certified to ISO/IEC 17025 or ASTM E2797 (Standard Guide for Ruby Fluorescence Thermobarometry), the system implements calibration protocols consistent with widely adopted literature references—including Mao et al. (1986), Piermarini et al. (1972), and the more recent Datchi et al. (2007) and Akahama & Kawamura (2004) formulations—ensuring traceability to internationally recognized pressure scales. Data acquisition logs include timestamped metadata (excitation wavelength, objective ID, integration time, CCD gain), supporting GLP-compliant documentation workflows.
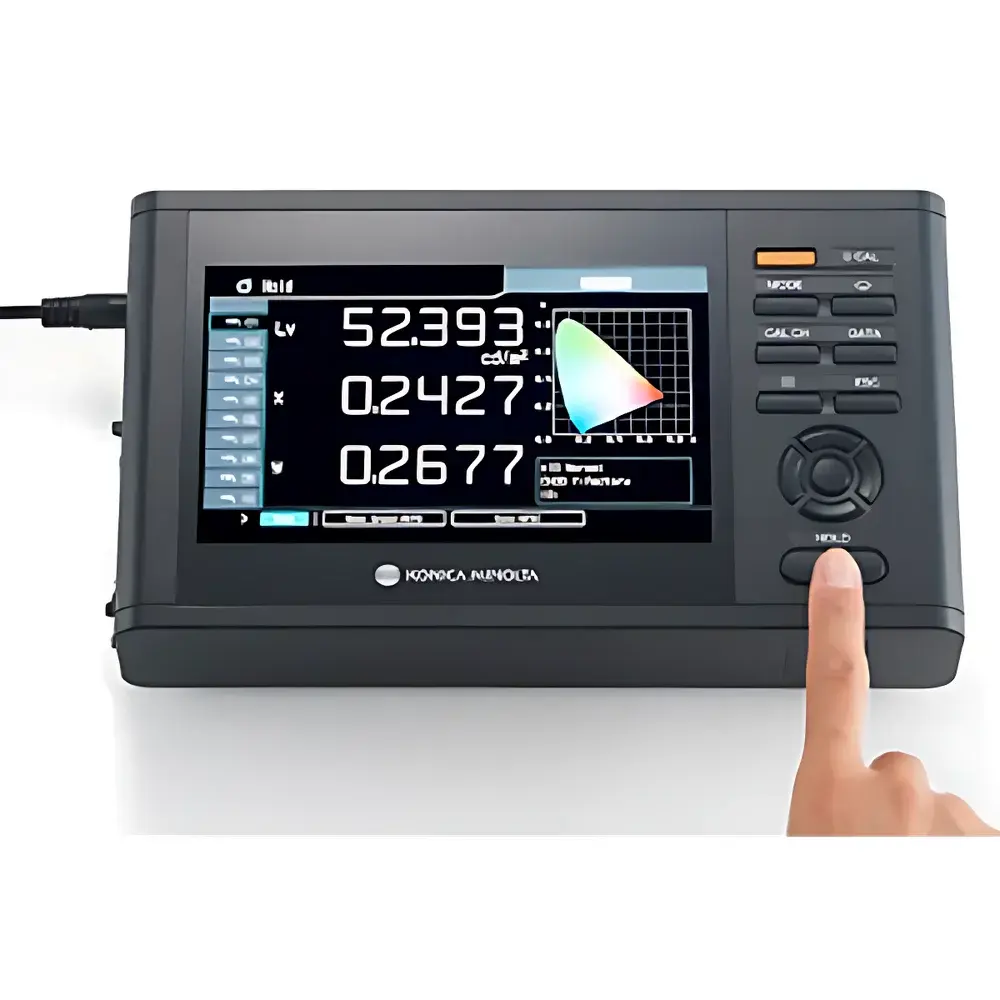
Software & Data Management
The proprietary SPL-SpectraControl software provides a unified interface for spectral acquisition, CCD imaging, and pressure calculation. It features automated centroid fitting of the R₁ line using Gaussian-Lorentzian deconvolution, with manual override for overlapping peaks or low-SNR conditions. Pressure values are computed in real time and displayed in the lower-right corner of the GUI, alongside raw spectra, peak position (nm), full-width-at-half-maximum (FWHM), and baseline-corrected intensity. All acquired datasets are saved in HDF5 format with embedded metadata (EXIF-like tags), ensuring compatibility with Python-based analysis pipelines (e.g., h5py, SciPy, Pandas). Audit trails—including operator ID, parameter changes, and calibration updates—are retained locally and exportable as CSV for regulatory review. The software does not implement FDA 21 CFR Part 11 electronic signature functionality but supports manual annotation and version-controlled report generation.
Applications
- In situ pressure calibration in static high-pressure experiments using diamond anvil cells
- Correlative micro-Raman spectroscopy for phase identification, strain mapping, and elastic constant estimation under pressure
- Thermobarometric studies combining ruby fluorescence with secondary thermometers (e.g., SrB₄O₇:Sm²⁺, Nd:YAG)
- Development and validation of new pressure standards (e.g., Si, MgO, Pt) against ruby reference lines
- Teaching and training in high-pressure physics, solid-state chemistry, and planetary mineralogy laboratories
- Quality assurance in industrial high-pressure synthesis facilities requiring traceable pressure monitoring
FAQ
What is the minimum detectable pressure shift in the R₁ line?
The system achieves a spectral resolution of ≤0.15 nm (FWHM) with the 532 nm excitation and 10× objective, corresponding to a theoretical pressure resolution of ~0.1 GPa across the full 0–100 GPa range.
Can the SPL-Micro2000 be used with cryogenic DAC stages?
Yes—provided optical access is maintained and vibration isolation is implemented; the vertical configuration minimizes interference from cold-finger geometry.
Is third-party laser integration supported?
Yes; the system accepts free-space or fiber-coupled lasers within the 400–600 nm range, subject to beam alignment verification and power stability assessment.
Does the software support batch processing of multiple spectra?
Yes—via scripting interface (Python API) and command-line tools included in the software development kit (SDK).
How is λ₀ (zero-pressure R₁ wavelength) determined and entered?
Users measure a reference ruby chip at ambient pressure using the same optical path and enter the experimentally observed R₁ peak position manually into the software’s calibration panel prior to high-pressure runs.