BQE-100C Quantum Efficiency Measurement System
| Origin | Japan |
|---|---|
| Manufacturer Type | Authorized Distributor |
| Origin Category | Imported |
| Model | BQE-100C |
| Price Range | USD 14,000 – 70,000 (FOB) |
| Measurement Mode | DC |
| Wavelength Range | 300–1100 nm |
| Wavelength Purity | ≈20 nm |
| Illumination Area | 10 mm × 10 mm |
| Irradiance | >100 μW/cm² (at ~470 nm) |
| Detector | Calibrated Si Photodiode (Si-PD) |
| Light Source | 150 W Ozone-Free Xenon Arc Lamp |
| Software Functionality | Real-time spectral irradiance display, spectral response (SR) calculation, external quantum efficiency (EQE) derivation, Jsc integration (mA/cm²) |
| OS Compatibility | Windows 7 (64-bit) |
Overview
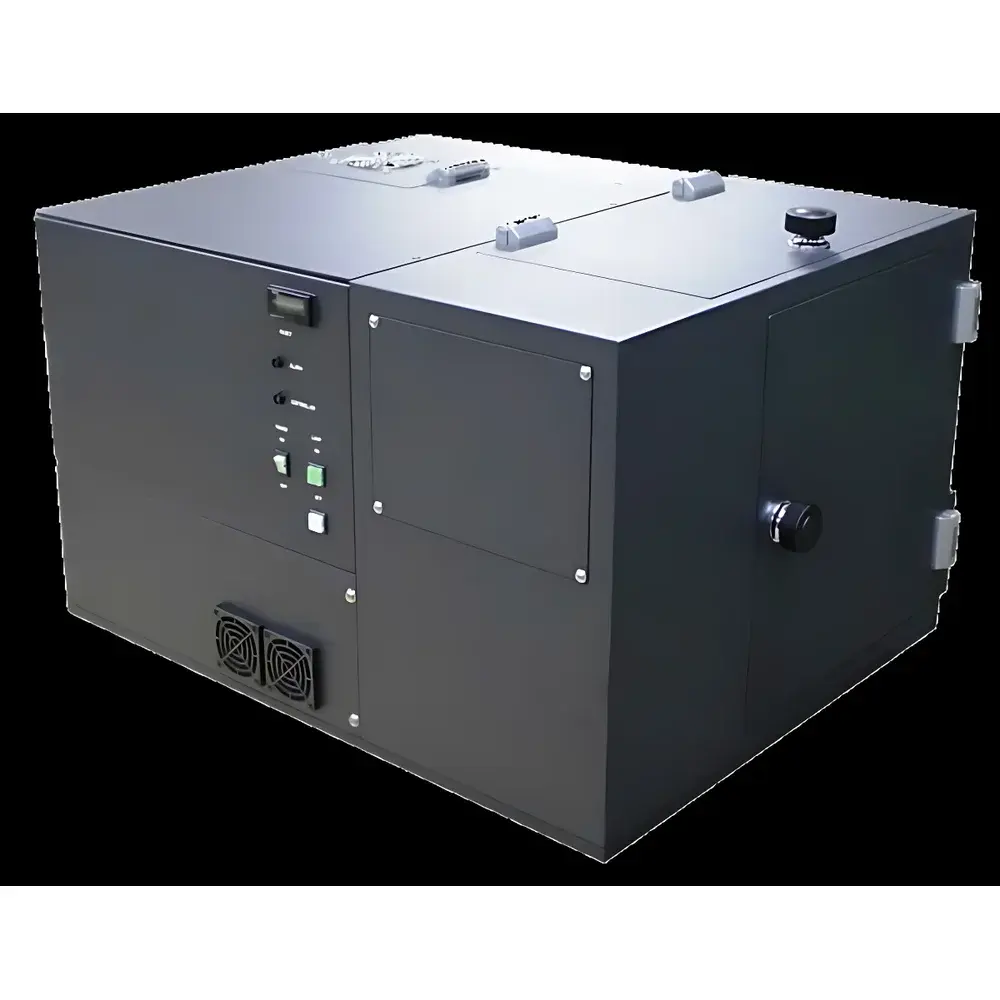
The BQE-100C Quantum Efficiency Measurement System is a precision DC-based photometric instrumentation platform engineered for quantitative evaluation of spectral responsivity and external quantum efficiency (EQE) in optoelectronic devices—primarily photovoltaic (PV) materials and solar cell prototypes. It operates on the fundamental principle of monochromatic photocurrent measurement: a tunable, ozone-free 150 W xenon arc lamp coupled with a grating monochromator delivers discrete wavelength bands (300–1100 nm) onto the device under test (DUT), while a calibrated silicon photodiode (Si-PD) provides traceable reference irradiance monitoring at each step. EQE is calculated as the ratio of collected charge carriers (electrons) per incident photon at a given wavelength, expressed as EQE(λ) = (1240 × Iph(λ)) / (λ × Pin(λ)), where Iph is photocurrent density (A/cm²), λ is wavelength (nm), and Pin is incident spectral irradiance (W/cm²/nm). This system does not correct for surface reflection losses—thus reporting true external (not internal) quantum efficiency—making it fully compatible with ASTM E1021 and IEC 60904-8 standards for PV device characterization.
Key Features
- DC-mode operation ensures stable, low-noise current acquisition—critical for high-reproducibility EQE mapping of low-diffusion-length thin-film absorbers (e.g., perovskites, CIGS, organic PV).
- Ozone-free xenon lamp guarantees spectral stability across UV–NIR without UV-induced degradation of sensitive samples or optical components.
- Monochromator with ≈20 nm bandwidth enables resolution sufficient to resolve major absorption edges (e.g., Si at 1100 nm, GaAs at 870 nm) while maintaining adequate photon flux for sub-mA/cm² photocurrent detection.
- Fixed 10 mm × 10 mm collimated illumination spot ensures uniform excitation geometry, minimizing edge effects and enabling direct correlation with standard test cell area definitions (IEC 60904-1).
- Integrated Si-PD reference detector—factory-calibrated against NIST-traceable standards—enables absolute EQE determination without user recalibration between sessions.
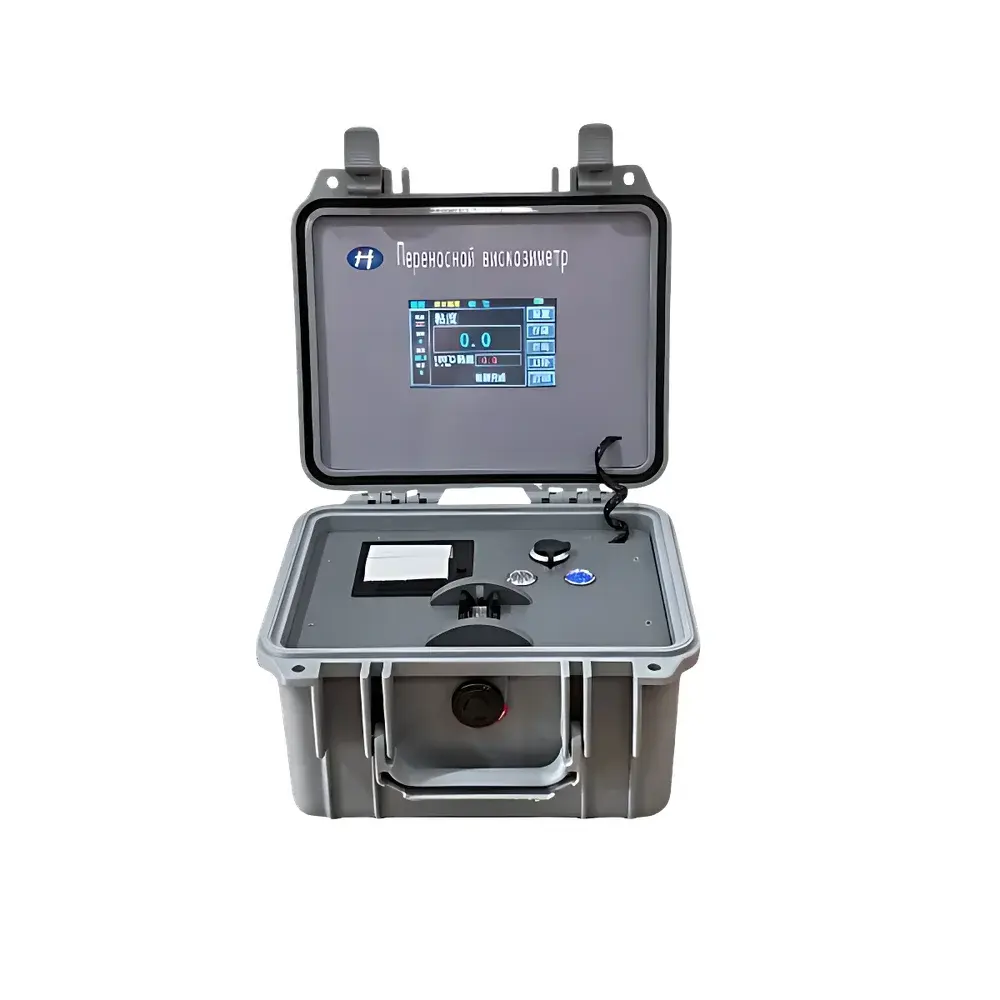
- Real-time software feedback displays irradiance (μW/cm²), spectral response (A/W), and EQE (%) synchronously during scan, allowing immediate identification of artifacts such as spectral crosstalk or amplifier saturation.
Sample Compatibility & Compliance
The BQE-100C accommodates standard PV test coupons (up to 25 mm × 25 mm), bare wafers, and encapsulated mini-modules with active-area alignment via integrated crosshair targeting. Electrical interfacing supports two-terminal (cell-only) and four-terminal (separate voltage/current leads) configurations to eliminate series resistance errors. All hardware and firmware comply with CE electromagnetic compatibility (EMC) directives. The measurement methodology adheres to ISO/IEC 17025–aligned laboratory practices; raw data files include metadata required for GLP audit trails (timestamp, lamp hours, monochromator position, detector gain setting, DUT bias voltage). While not FDA 21 CFR Part 11–certified out-of-the-box, the software architecture supports optional digital signature logging and user-access-level configuration for GMP-aligned R&D environments.
Software & Data Management
The native Windows 7–compatible application provides full control over scan parameters (wavelength step size, dwell time, averaging cycles), real-time curve overlay (EQE vs. SR vs. irradiance), and automated Jsc integration using AM1.5G reference spectrum (IEC 60904-3). Export formats include CSV (tabular wavelength–EQE pairs), PNG/SVG (publication-ready plots), and XML (metadata-rich archives for LIMS integration). All calibration coefficients—including Si-PD responsivity curves and monochromator throughput corrections—are embedded and version-locked within the instrument profile. No cloud dependency: all processing occurs locally, ensuring data sovereignty and compliance with institutional IT security policies.
Applications
- Development-stage EQE profiling of emerging absorber layers (e.g., tandem perovskite–silicon stacks) to quantify carrier collection efficiency per subcell.
- Root-cause analysis of spectral mismatch in multi-junction cells by resolving EQE dips attributable to interfacial recombination or parasitic absorption.
- Validation of anti-reflection coating performance via comparative EQE measurements before/after deposition.
- Stability assessment under light soaking: sequential EQE scans track degradation kinetics at critical wavelengths (e.g., UV-induced halide segregation in perovskites).
- Teaching laboratories: hands-on demonstration of photogeneration physics, bandgap determination from EQE onset, and Jsc prediction accuracy versus actual IV testing.
FAQ
Does the BQE-100C support bias light illumination during EQE measurement?
Yes—optional LED-based white-light bias sources (300–1100 nm, up to 1-sun intensity) can be integrated to simulate operating conditions and assess voltage-dependent collection efficiency.
Can EQE data be exported for use in TCAD simulation tools?
Absolutely—CSV exports contain wavelength (nm), EQE (%), and SR (A/W) columns with 1 nm or user-defined step resolution, directly ingestible by Sentaurus Device, Silvaco Atlas, or similar semiconductor modeling platforms.
Is lamp replacement a user-serviceable procedure?
Xenon lamp replacement requires optical realignment and factory recalibration of the Si-PD reference path; therefore, it must be performed by authorized service personnel to maintain measurement traceability.
What is the minimum measurable EQE value with stated uncertainty?
At 800 nm, the system achieves <±1.5% relative uncertainty (k=2) down to EQE = 0.1%, limited primarily by dark current stability and reference detector SNR—not by monochromator stray light.
Does the software support batch processing of multiple samples?
Yes—scriptable macros enable unattended sequential scanning of up to 12 samples using motorized stage presets, with auto-named file generation and summary statistics per run.