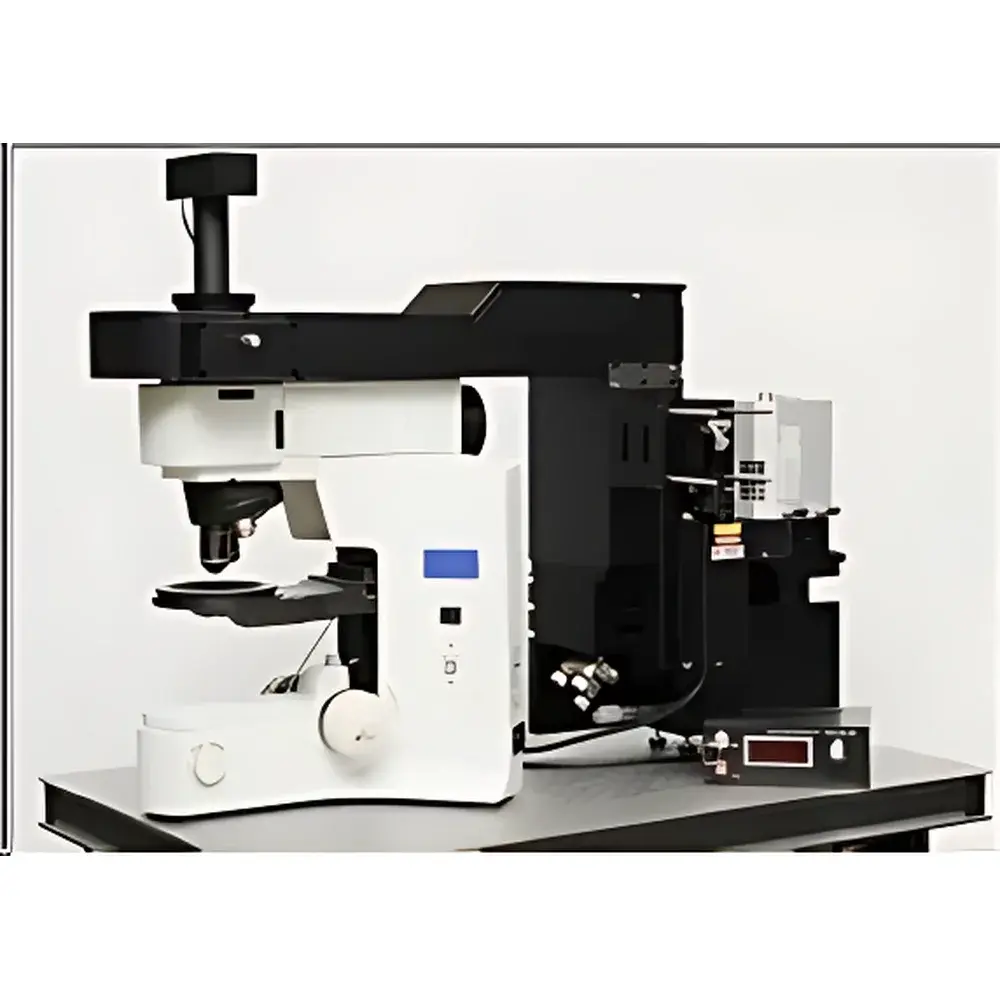
Nanobase XperRam 200 Confocal Raman Imaging System
| Brand | Nanobase |
|---|---|
| Origin | South Korea |
| Model | CONFOCAL_RAMAN_IMAGING_SYSTEM |
| Excitation Laser | 532 nm (up to 100 mW DPSS), optional 660 nm / 785 nm |
| Objective | 40×, NA = 0.75 |
| Scan Area | ≥200 µm × 200 µm |
| Spectral Resolution (FWHM) | ~0.12 nm |
| Dispersion | ~0.038 nm/pixel |
| Grating | 1800 lp/mm VPHG (transmission-type volume phase holographic grating) |
| Polarization Control | Excitation (0–180° continuous rotation), Collection (extinction ratio >200:1, transmission >83%) |
| Notch Filter | OD >6 (blocking >99.9999%), bandwidth <0.5 nm FWHM |
| Bandpass Filter | OD7, bandwidth <0.3 nm, diffraction efficiency >90% |
| Detector Compatibility | Andor, Princeton Instruments CCD/CMOS cameras |
| Software Platform | LabVIEW-based control with real-time spectral acquisition and mapping engine |
| Compliance | Designed for GLP/GMP-aligned workflows |
Overview
The Nanobase XperRam 200 Confocal Raman Imaging System is a research-grade, modular confocal micro-Raman platform engineered for high-fidelity chemical mapping and spatially resolved vibrational spectroscopy. Built upon a true confocal optical architecture, it combines diffraction-limited lateral resolution (60% transmission from 360–1000 nm) and minimal polarization sensitivity—critical for quantitative polarization-resolved Raman studies. Unlike reflective grating spectrometers, the VPHG design ensures high diffraction efficiency across the visible range and eliminates ghosting artifacts, supporting reproducible spectral calibration over extended acquisition periods. The integrated XYZ motorized stage, coupled with galvanometric laser scanning optics, enables rapid raster-scanned hyperspectral imaging at sub-micron pixel resolution across areas exceeding 200 µm × 200 µm—ideal for thin-film characterization, semiconductor defect localization, and pharmaceutical API distribution analysis.
Key Features
- Confocal architecture with adjustable pinhole aperture for optimized depth discrimination and signal-to-background ratio
- VPHG spectrometer (f/5, 200 mm focal length) with micrometer-driven center-wavelength tuning and <0.12 nm FWHM spectral resolution
- Real-time averaging mode: acquires full Raman spectra from 200 × 200 µm regions in ≤4 seconds, minimizing CCD readout noise via synchronized laser-on acquisition
- Dual-polarization control: continuously variable excitation polarization (0–180°) using zero-order half-wave plate; high-extinction collection polarizer (ER >200:1)
- Modular optical interface: FC/PC fiber coupling port, achromatic collimator (450–680 nm), embedded notch/bandpass filters (OD7, bandwidth <0.3 nm), and NIR-ready options (700–1000 nm)
- LabVIEW-driven control suite with hardware-synchronized timing, ROI masking, spectral library matching, and batch-processing pipelines for large-area maps
Sample Compatibility & Compliance
The XperRam 200 accommodates standard microscopy substrates—including glass slides, silicon wafers, polymer films, and metal-coated samples—without requiring conductive coating or vacuum environments. Its non-destructive, ambient-condition operation supports in situ and in vivo applications such as skin stratum corneum mapping and implant surface chemistry monitoring. The system meets core requirements for regulated environments: spectral data files include embedded timestamps, operator IDs, instrument configuration logs, and detector gain settings—enabling traceability per ISO/IEC 17025 and ASTM E1840-22. Optional 21 CFR Part 11-compliant software modules provide electronic signatures, role-based access control, and immutable audit trails—validated for QC labs operating under GMP or GLP frameworks.
Software & Data Management
Acquisition and analysis are unified within a native LabVIEW application featuring intuitive workflow scripting, multi-channel spectral overlay, PCA-based clustering, and false-color Raman map generation. Raw hyperspectral cubes (.spe or .h5 format) are fully compatible with third-party platforms including WiRE (Renishaw), GRAMS/AI (Thermo), and Python-based libraries (scikit-learn, HyperSpy). All metadata—including laser power (monitored via integrated photodiode), objective magnification, grating position, and filter configuration—is embedded in each spectrum header. Batch processing supports automated baseline correction (Asymmetric Least Squares), cosmic ray removal, and peak deconvolution using Voigt profiles—essential for quantifying crystallinity, stress, or phase ratios in composite materials.
Applications
- Pharmaceuticals: Spatial distribution mapping of active ingredients and excipients in tablets; polymorph identification in lyophilized formulations; counterfeit drug detection via spectral fingerprinting
- Semiconductors & Optoelectronics: Strain profiling in Si/SiGe heterostructures; Ge composition quantification; defect-associated modes in GaN HEMTs and perovskite solar cell layers
- Life Sciences: Label-free cellular organelle differentiation; lipid droplet dynamics in adipocytes; collagen cross-linking assessment in tissue-engineered scaffolds
- Materials Science: Phase segregation in battery cathode composites (e.g., NMC/LiCoO₂); carbon nanotube chirality mapping; graphene layer count verification via 2D band shape analysis
- Forensics: Non-contact identification of narcotics, explosives residues, and ink pigments on porous/non-porous surfaces per SWGDRUG guidelines
FAQ
What laser wavelengths are supported natively, and can the system be upgraded for NIR operation?
The base configuration includes a 532 nm DPSS laser (≤100 mW), with factory-integrated options for 660 nm and 785 nm diode lasers. NIR-ready optics—including broadband mirrors, VPHG gratings optimized for 785 nm, and extended-range detectors—are available as configurable modules.
Is the system compatible with third-party detectors beyond Andor and Princeton Instruments?
Yes—any scientific-grade CCD or sCMOS camera with USB 2.0/3.0 or Camera Link interface and SDK support can be integrated via custom driver development; Nanobase provides API documentation and reference LabVIEW VIs.
How is spectral calibration maintained during long-duration mapping sessions?
The VPHG grating exhibits negligible thermal drift; wavelength stability is further ensured by periodic auto-calibration using internal neon or argon emission lines, triggered at user-defined intervals or before/after each map.
Can polarization-resolved measurements be performed on anisotropic crystals?
Yes—the independent control of excitation and collection polarization axes enables complete Mueller matrix acquisition, supporting quantitative analysis of crystal orientation, symmetry breaking, and phonon selection rules in 2D materials.
Does the software support automated particle-by-particle spectral extraction from heterogeneous samples?
Yes—using morphological segmentation tools combined with spectral thresholding, the software isolates individual particles (e.g., nanoparticles, pigment granules) and exports their averaged spectra with positional metadata for statistical chemometric analysis.
Related Products