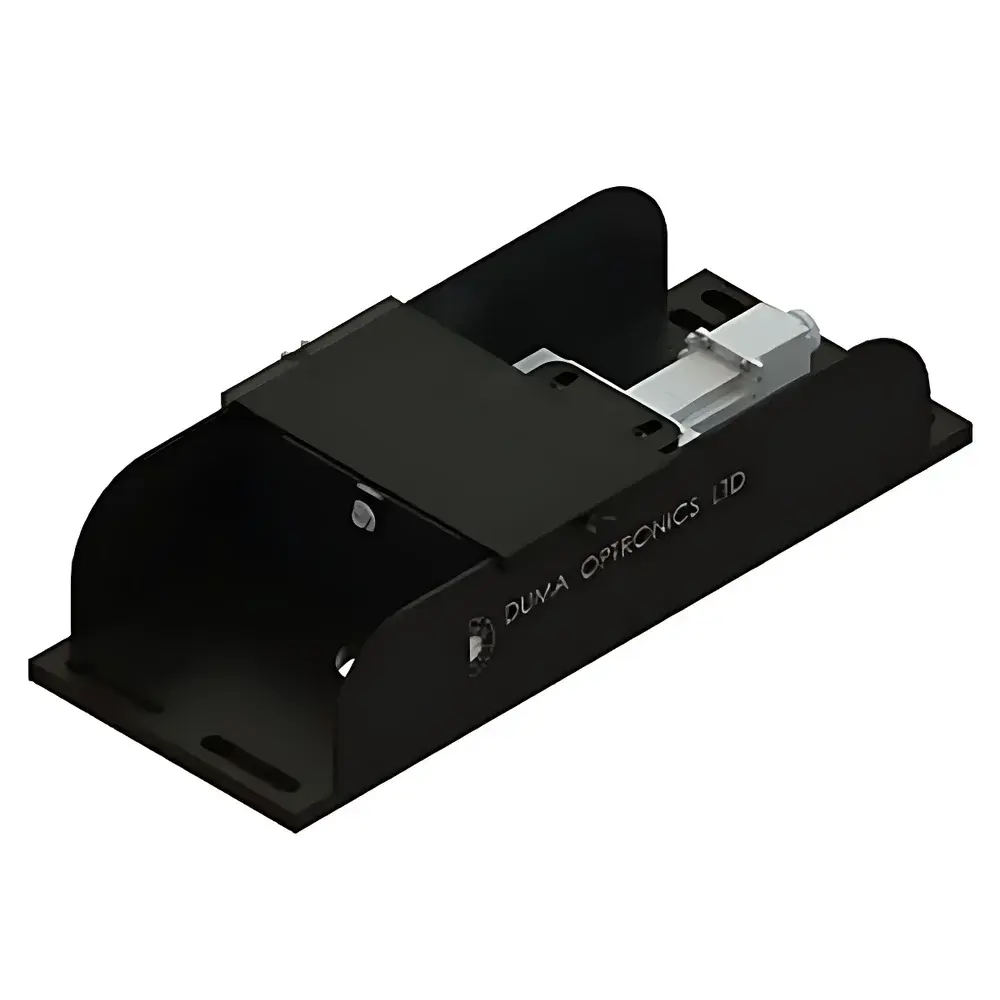
Duma Optronics M2Beam-Si M² Beam Quality Analyzer
| Brand | Duma Optronics |
|---|---|
| Origin | Israel |
| Model | M2Beam-Si |
| Spectral Range (Si) | 350–1100 nm |
| Detector Type | Silicon photodiode array |
| M² Accuracy | ±5% |
| Maximum Measurable Beam Diameter (with lens) | 25 mm |
| Scanning Step Resolution | 100 µm |
| Scan Length | 280 mm |
| Lens Focal Length | 300 mm @ 632.6 nm |
| Beam Power Range (Si) | 100 µW – 1 W (with internal filter wheel) |
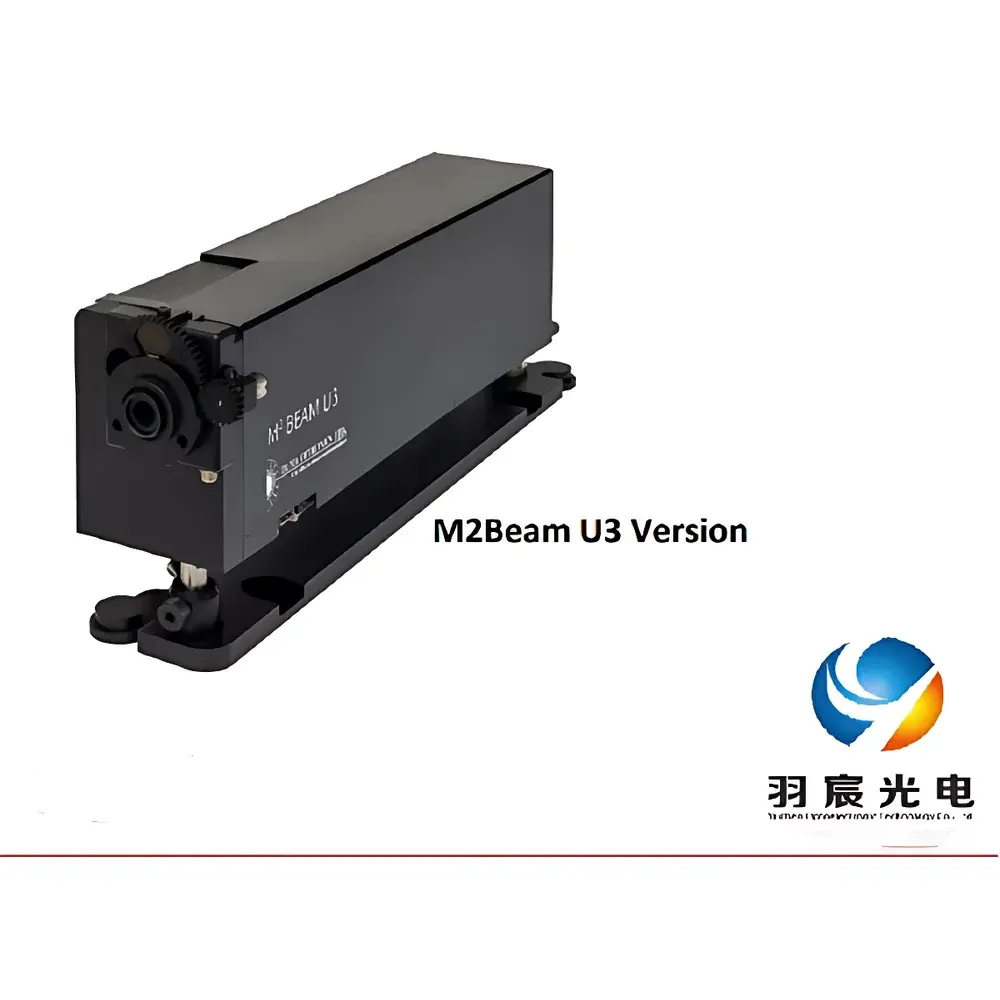
| Physical Dimensions | 100 × 173 × 415 mm |
| Weight | 2.5 kg |
| Interface | USB 3.0 |
| Compliance | ISO 11146-1:2005, ISO 11146-2:2005, ISO 13694:2000 |
Overview
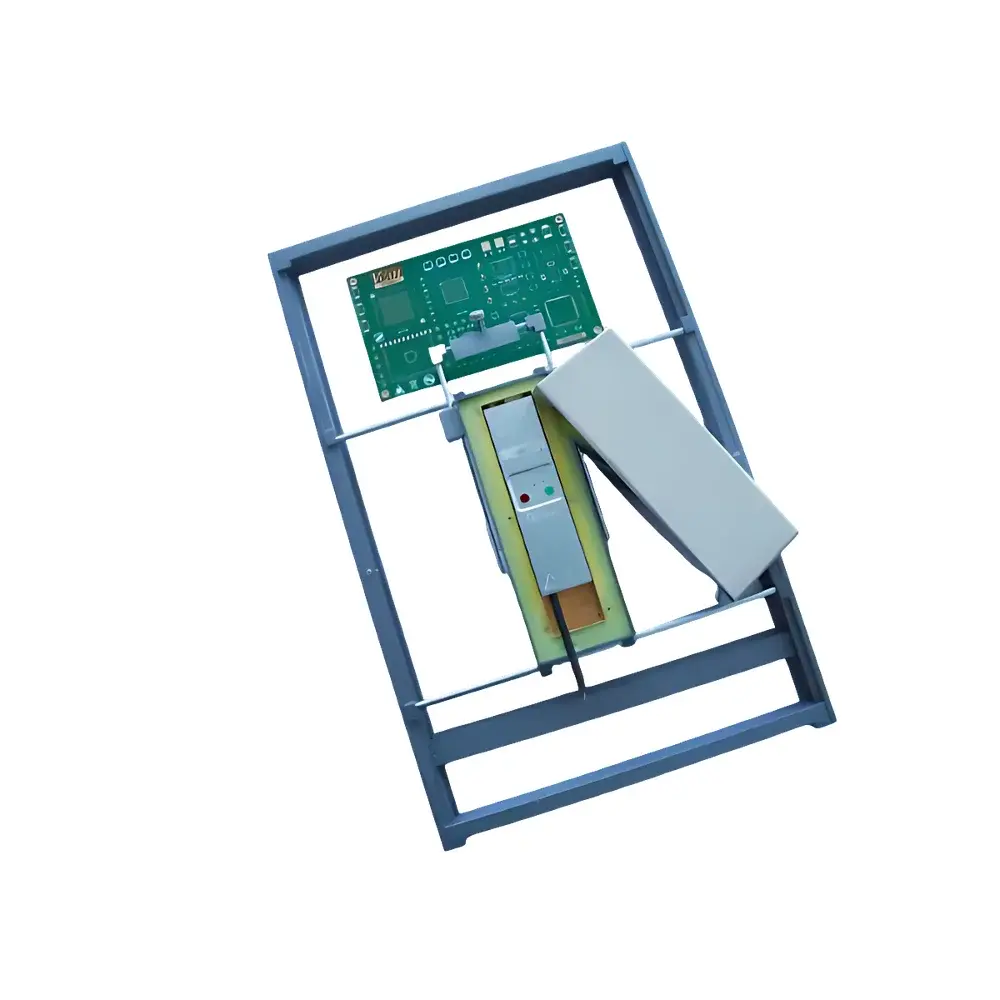
The Duma Optronics M2Beam-Si is a precision-engineered M² beam quality analyzer designed for rigorous characterization of continuous-wave (CW) and quasi-CW laser beams in the visible to near-infrared spectrum (350–1100 nm). It operates on the industry-standard knife-edge scanning principle defined in ISO 11146-1 and ISO 11146-2, enabling traceable, repeatable measurement of the fundamental beam propagation parameters critical to laser system integration and optical alignment. Unlike camera-based profilers, the M2Beam-Si employs a multi-knife-edge (7-blade) scanning architecture coupled with a calibrated silicon photodiode detector, delivering high dynamic range and immunity to pixel saturation or blooming effects—particularly advantageous for beams with high peak-to-background ratios or non-Gaussian intensity profiles. The system’s fixed 300 mm focal-length lens (optimized at 632.6 nm) and precisely controlled 140-step mechanical scan over 280 mm ensure sub-100 µm positional reproducibility, directly supporting accurate determination of beam waist location, Rayleigh range, divergence angle, and astigmatism asymmetry.
Key Features
- ISO-compliant M² measurement with ±5% uncertainty across full spectral range (350–1100 nm)
- Seven-position motorized knife-edge scanning mechanism with 100 µm minimum step resolution and 280 mm total scan length
- Integrated filter wheel for automatic attenuation—enabling stable measurements from 100 µW to 1 W without manual intervention
- Modular design: detachable scanning head functions as a standalone beam profiler for alignment and diagnostics
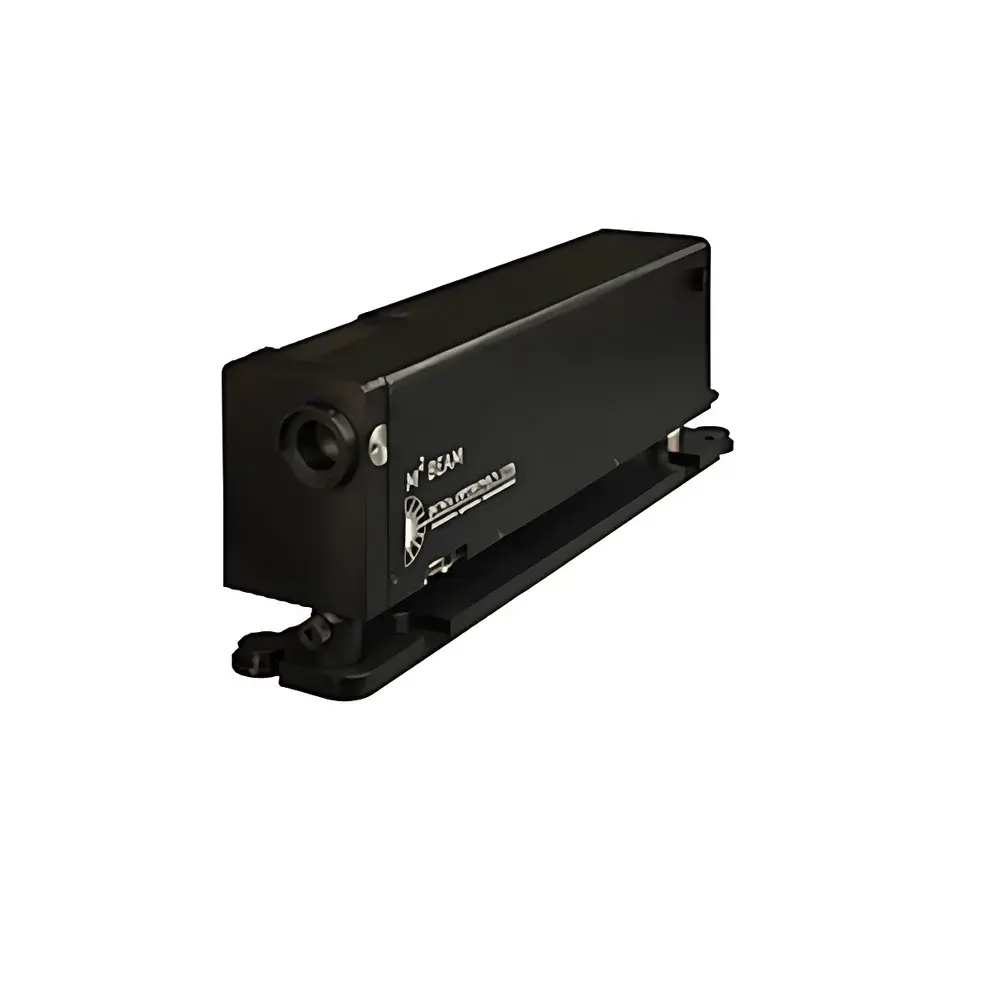
- Aluminum housing with precision-machined kinematic mounts; horizontal and vertical angular adjustment ±1.5° for fine beam centering
- USB 3.0 interface ensures real-time data streaming and low-latency synchronization between scan position and detector signal
- Compatible with optional high-power beam samplers (e.g., SAM3-HP-M) for safe characterization of beams up to 4 kW
Sample Compatibility & Compliance
The M2Beam-Si is validated for use with collimated or weakly divergent laser beams requiring waist reconstruction at distances of 2.0–2.5 m from the focusing lens—optimized for standard laboratory optical tables. Its 25 mm maximum measurable beam diameter (with lens) accommodates multimode fiber outputs, diode bars, and solid-state lasers with moderate divergence. All measurement algorithms adhere strictly to ISO 11146-1:2005 (determination of beam widths, divergence angles, and M²) and ISO 13694:2000 (laser beam parameter definitions). Data acquisition and reporting support GLP/GMP-aligned workflows through timestamped metadata, instrument calibration ID logging, and audit-ready export formats (CSV, XML). While not FDA 21 CFR Part 11-certified out-of-the-box, the software architecture permits integration into validated environments via external electronic signature and audit trail modules.
Software & Data Management
Operated via Duma’s proprietary BeamGage™ Professional software (v6.x), the M2Beam-Si provides real-time visualization of normalized second-moment beam width vs. scan position, automatic Gaussian fit residuals analysis, and comparative M² overlays across multiple acquisitions. Raw voltage vs. position datasets are stored with full header metadata—including date/time, lens ID, filter position, ambient temperature, and user-defined notes. Export options include IEEE-compliant CSV for MATLAB/Python post-processing, PNG/PDF reports with embedded ISO conformance statements, and XML files compatible with LIMS platforms. Batch processing supports automated M² trending across production lots or R&D test cycles, with configurable pass/fail thresholds based on user-specified tolerance bands.
Applications
- Quantitative verification of laser cavity design performance (e.g., resonator stability, thermal lensing effects)
- End-of-line testing of fiber-coupled diode modules and DPSS lasers in manufacturing QA/QC labs
- Beam delivery system validation for industrial cutting/welding platforms (M² correlation with focusability)
- Research-grade characterization of ultrafast amplifier outputs prior to pulse compression
- Cross-platform benchmarking against camera-based profilers (e.g., for clipped or high-dynamic-range beams)
- Supporting ISO 11146-compliant calibration services for accredited metrology laboratories
FAQ
What beam types can the M2Beam-Si characterize?
It is optimized for CW and long-pulse lasers (pulse width > 10 µs) with average power between 100 µW and 1 W in the 350–1100 nm range. Pulsed lasers require external synchronization or averaging modes.
Is calibration traceable to national standards?
Yes—each unit ships with a factory calibration certificate referencing NIST-traceable radiometric standards; annual recalibration services are available through Duma’s ISO/IEC 17025-accredited service center.
Can it measure elliptical or astigmatic beams?
Yes—dual-axis scanning enables independent M² calculation for major and minor axes, quantifying astigmatism magnitude and orientation per ISO 11146-2.
How does it handle high-power beams exceeding 1 W?
Direct measurement is not recommended above 1 W; users must integrate a calibrated beam sampler (e.g., SAM3-HP-M) to reduce incident power to within the Si detector’s linear range while preserving spatial fidelity.
Does the system support automated pass/fail reporting for production lines?
Yes—BeamGage™ Professional includes configurable QC templates with statistical process control (SPC) charts, histogram overlays, and automated PDF report generation upon measurement completion.