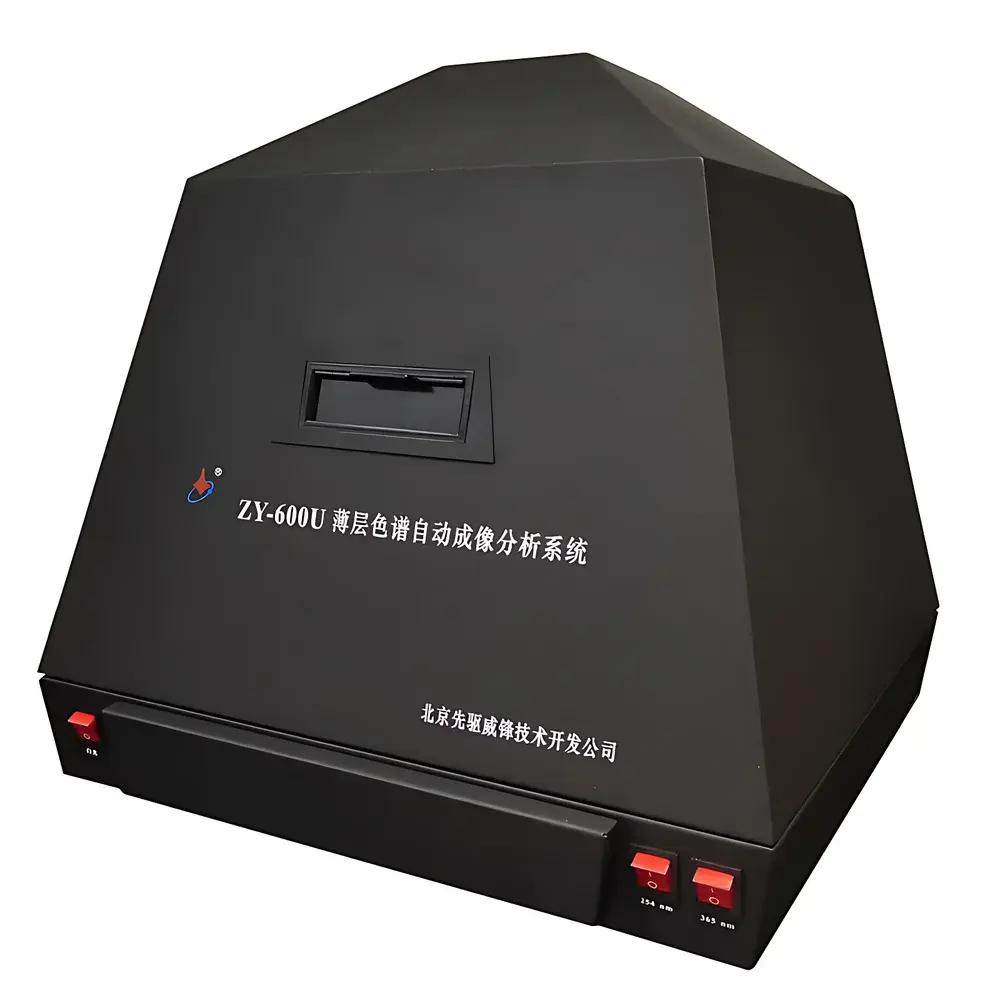
Forerunner ZY-600U Automated TLC Imaging and Analysis System
| Brand | Forerunner |
|---|---|
| Origin | Beijing, China |
| Manufacturer Type | Authorized Distributor |
| Instrument Category | Domestic |
| Model | ZY-600U |
| Instrument Type | TLC Imaging System |
| Operation Mode | Fully Automatic |
| Measurement Mode | Transmitted Fluorescence |
| Wavelength Range | 190–800 nm |
| Light Sources | UV Lamps (254 nm & 365 nm), White Light Lamp (400–750 nm) |
| Detector | High-Sensitivity CCD Camera |
| Spectral Bandwidth | 5 nm |
| Wavelength Accuracy | ±1 nm |
| Wavelength Repeatability | ≤0.01 cm⁻¹ |
| Spatial Resolution | 0.01 cm |
| Imaging Wavelengths | UV254/UV365 (transmission), Visible (400–750 nm) |
| Sample Stage Dimensions | 200 mm × 200 mm |
| Scanning Speed | 100 mm/s |
| Image Sensor | 1280 × 1024 pixels, high-frame-rate acquisition |
| UV Transmission Efficiency | ≥92% |
| OS Compatibility | Windows 2000/XP |
| Interface | USB 2.0 |
| Rf Calculation Accuracy | ≤0.01 cm repeatability |
| Inter-unit Measurement Variation | ≤0.5% |
| Data Export Formats | JPG, BMP, TIFF, PNG |
Overview
The Forerunner ZY-600U Automated TLC Imaging and Analysis System is a dedicated digital imaging platform engineered for high-fidelity documentation and quantitative evaluation of thin-layer chromatography (TLC) plates under controlled illumination conditions. It operates on the principle of transmitted light detection—specifically optimized for fluorescence excitation and visible-light absorption—enabling precise visualization and spatial characterization of analyte bands separated on silica gel, aluminum oxide, or cellulose-based stationary phases. Unlike manual visual inspection or analog photography, the ZY-600U integrates synchronized UV/visible illumination, motorized stage translation, and calibrated CCD-based image capture to eliminate operator bias and ensure traceable, repeatable results. Its design supports compliance-driven laboratory environments where documentation integrity, measurement reproducibility, and audit-ready data handling are mandatory.
Key Features
- Fully automated scanning workflow with programmable stage movement (200 mm × 200 mm active area) and real-time image acquisition at 100 mm/s linear speed.
- Dual-mode illumination system: high-stability UV lamps (254 nm and 365 nm) with ≥92% quartz filter transmission efficiency, plus broadband white light (400–750 nm) for non-fluorescent compound visualization.
- High-resolution CCD imaging sensor (1280 × 1024 pixels) with low-noise architecture and uniform quantum efficiency across UV–vis spectrum; supports high-frame-rate continuous capture for motion artifact suppression.
- Optical path engineered with interference-grade UV-transmissive filters to suppress stray visible light and out-of-band emission—critical for accurate fluorescence band localization and intensity quantification.
- Integrated wavelength calibration reference and spectral bandwidth control (5 nm FWHM), ensuring consistent photometric response across instruments and over time.
- Onboard spatial calibration routine enabling sub-millimeter resolution (0.01 cm) and ≤0.01 cm repeatability in Rf value determination—validated against NIST-traceable reticles.
Sample Compatibility & Compliance
The ZY-600U accommodates standard commercial TLC plates (e.g., Merck Silica Gel 60 F254, Analtech Uniplates, Sorbent Technologies plates) up to 20 × 20 cm format, including glass-, aluminum-, and polyester-backed variants. It supports both fluorescent indicator–impregnated layers (e.g., F254/F365) and non-destructive visualization methods such as iodine vapor or anisaldehyde staining followed by visible-light imaging. The system conforms to analytical documentation requirements outlined in ICH Q5A(R2), USP , and EP 2.2.27 for chromatographic identification and purity assessment. All image metadata—including timestamp, lamp status, exposure parameters, and stage coordinates—is embedded and preserved in exported files. Audit trails, user access logs, and electronic signature support can be implemented via optional workstation configuration aligned with FDA 21 CFR Part 11 and GLP/GMP Annex 11 expectations.
Software & Data Management
The ZY-600U is operated through the proprietary ZY-600U Workstation software (Windows 2000/XP compatible, USB 2.0 interface). The application provides background subtraction algorithms, dynamic contrast adjustment, and multi-threshold band detection to isolate low-intensity spots amid heterogeneous plate backgrounds. It automatically computes Rf values relative to solvent front and origin line, performs peak area integration using pixel intensity summation (with optional Gaussian deconvolution), and exports quantitative reports in CSV, PDF, or XML formats. All images are stored with EXIF-compliant metadata and support lossless compression (TIFF) or publication-grade rendering (PNG, JPG, BMP). Software updates are delivered via secure HTTP channel with version-controlled changelogs and backward-compatible file format preservation.
Applications
This system serves laboratories engaged in pharmaceutical quality control (e.g., raw material identity testing per USP monographs), natural product isolation workflows, pesticide residue screening in food matrices (AOAC 2007.01–compatible), forensic toxicology (drug metabolite profiling), and academic teaching of separation science principles. Its ability to document migration behavior under multiple excitation wavelengths makes it especially valuable for compounds exhibiting dual fluorescence (e.g., polycyclic aromatic hydrocarbons, flavonoids, alkaloids) or differential quenching responses. In clinical research settings, it supports rapid qualitative assessment of urinary organic acids or serum bile acid profiles following derivatization and TLC separation.
FAQ
Does the ZY-600U support GMP/GLP-compliant reporting?
Yes—the workstation generates fully traceable reports with embedded instrument parameters, operator ID, date/time stamps, and raw image archives. Optional configurations include electronic signatures and audit trail modules compliant with 21 CFR Part 11.
Can the system quantify spot intensity linearly across concentration ranges?
Within defined dynamic ranges (validated per ICH Q2(R2) linearity guidelines), pixel-integrated intensity demonstrates R² ≥0.995 for standards with known molar absorptivity or quantum yield; linearity validation is user-performed per application.
Is calibration required before each analysis session?
A one-time spatial calibration suffices for routine use; however, wavelength verification using mercury-argon emission lines is recommended quarterly or after lamp replacement.
What plate thicknesses are supported?
Plates up to 3 mm total thickness (including backing) are accommodated; optimal focus is maintained across 0.2–2.0 mm layer thicknesses using fixed-focus optical geometry.
Can third-party image analysis tools import ZY-600U output files?
Yes—all exported images retain full 16-bit depth (TIFF) or 24-bit RGB fidelity (PNG/JPG), and CSV-based peak tables are compatible with MATLAB, R, ImageJ/Fiji, and commercial chemometrics platforms.


")
