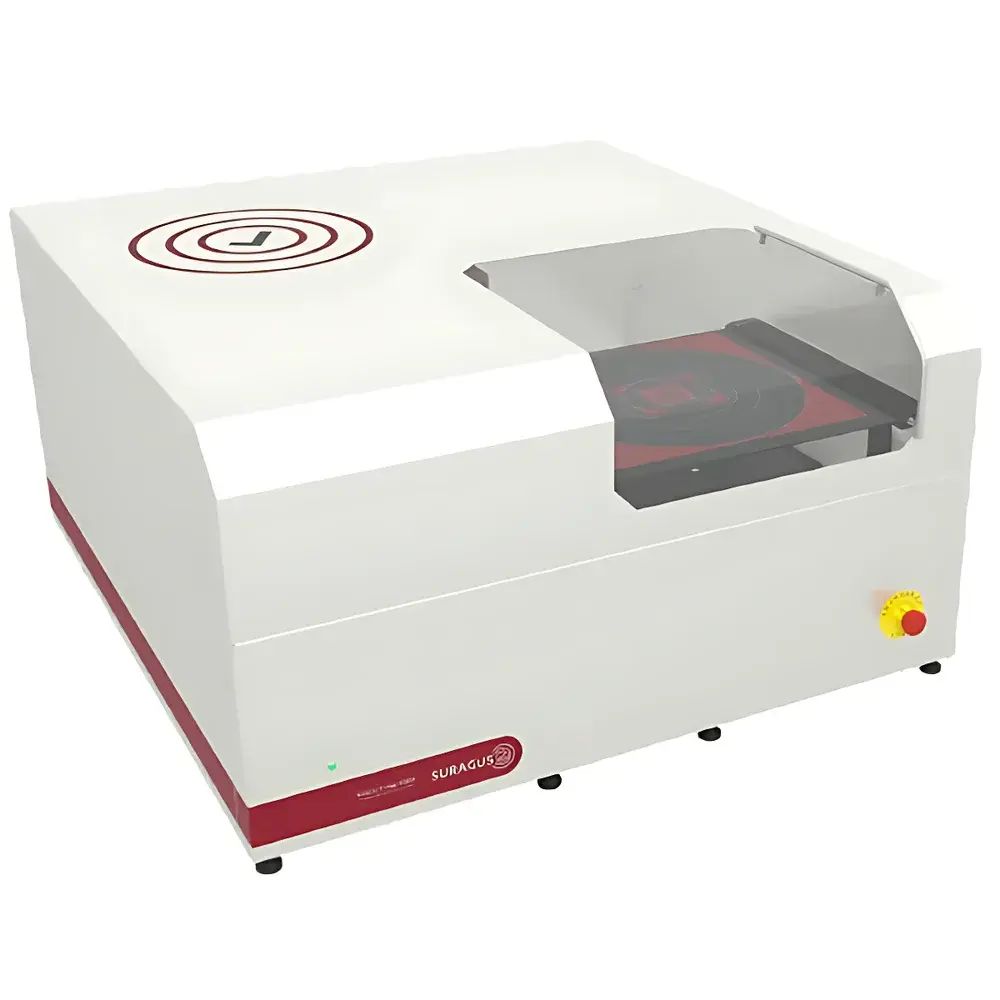
SURAGUS 2530 Sheet Resistance & Thin-Film Thickness Mapping System
| Brand | SURAGUS |
|---|---|
| Origin | Germany |
| Model | SURAGUS 2530 |
| Measurement Principle | Non-contact Eddy Current |
| Max Scan Area | 300 × 300 mm (12 inch) |
| Sheet Resistance Range | 0.0001–10,000 Ω/□ (accuracy 2–8%) |
| Thickness Range (metal films) | 2 nm – 2 mm |
| Spatial Resolution | Adjustable scan pitch (1/2/5/10 mm) |
| Max Data Points | 1,000,000 per map |
| Measurement Speed | Up to 10,000 points in 5 min |
| Edge Compensation | ±2 mm exclusion zone |
| Sensor Gap Options | 2 / 5 / 10 / 25 mm |
Overview
The SURAGUS 2530 Sheet Resistance & Thin-Film Thickness Mapping System is a non-contact, eddy current-based metrology platform engineered for high-resolution spatial characterization of conductive thin films and coatings. Designed for R&D laboratories and quality control environments, it delivers quantitative, pixel-level maps of sheet resistance (Rs, Ω/□) and derived metal film thickness—without physical contact, surface preparation, or electrical probing. Its operation relies on the electromagnetic induction principle: a high-frequency alternating magnetic field generated by a miniature coil sensor induces eddy currents in conductive layers; the resulting impedance shift is calibrated against known standards to extract Rs with traceable uncertainty. When combined with material-specific conductivity data (e.g., bulk resistivity of Al, Cu, ITO), film thickness is computed via the fundamental relation t = ρ / Rs. The system supports substrates ranging from flexible polymer foils and tempered architectural glass to rigid silicon wafers and ceramic carriers—enabling consistent measurement across diverse industrial applications where uniformity, defect localization, and process stability are critical.
Key Features
- Non-contact eddy current sensing eliminates risk of scratching, contamination, or probe-induced artifacts—essential for delicate OLED anodes, graphene monolayers, or low-temperature processed PEDOT:PSS films.
- High-density spatial mapping: configurable scan pitch (1–10 mm) enables up to 1,000,000 measurement points per full 300 × 300 mm map, delivering statistical confidence in uniformity analysis.
- Multi-parameter output per pixel: simultaneous Rs (Ω/□), derived thickness (nm/µm), and anisotropy index—calculated from orthogonal directional scans to detect directional deposition effects or grid-line asymmetry.
- Edge-effect compensation algorithm automatically excludes a user-defined 2 mm border region, ensuring metrological integrity near sample peripheries where field distortion occurs.
- Modular sensor gap options (2 / 5 / 10 / 25 mm) accommodate varying substrate warpage, encapsulation layers, or thick carrier plates—maintaining signal fidelity without mechanical recalibration.
- Robust thermal and drift compensation ensures measurement repeatability (<2% RSD over 8-hour operation) under standard lab conditions (20–25°C, <60% RH).
Sample Compatibility & Compliance
The SURAGUS 2530 accepts planar samples up to 300 × 300 mm and 25 mm total height—including laminated stacks (e.g., Low-E coated glass + PET interlayer), flexible roll-to-roll foils, and semiconductor wafers with dielectric passivation. It complies with ISO/IEC 17025 metrological traceability requirements when used with NIST-traceable calibration standards. For regulated industries, raw data files include embedded timestamps, operator ID, instrument serial number, and full audit trail metadata—supporting GLP and GMP documentation workflows. While not FDA 21 CFR Part 11–certified out-of-the-box, its software architecture permits integration with validated electronic lab notebook (ELN) systems via secure API export (CSV, HDF5, or XML formats).
Software & Data Management
Control and analysis are performed using SURAGUS TF Lab Suite v4.x—a Windows-based application featuring real-time heatmap visualization, statistical overlay (mean, σ, min/max, histogram), and automated defect flagging based on user-defined Rs thresholds. All measurement sessions generate immutable project archives (.sra files) containing raw sensor data, calibration coefficients, environmental logs, and processing history. Batch reporting supports customizable templates aligned with internal QC protocols or external standards (e.g., ASTM F390 for transparent conductors). Export options include vector PDF for publication, GeoTIFF for CAD integration, and tabular CSV for SPC charting in JMP or Minitab.
Applications
- Architectural glazing: Quantifying Rs uniformity and pinhole density in sputtered Ag-based Low-E coatings across 3×3 m² panels.
- Display manufacturing: Verifying ITO or Ag nanowire network homogeneity on 8.5-gen TFT glass before patterning—detecting localized oxidation or etch residue.
- Flexible electronics: Mapping sheet resistance gradients in printed silver nanoparticle inks on PET substrates after thermal sintering.
- Photovoltaics: Monitoring Rs drift in transparent conductive oxides (TCOs) during accelerated damp-heat testing (IEC 61215).
- Emerging materials: Characterizing percolation thresholds in CNT/polymer composites and lateral conductivity anisotropy in CVD-grown graphene domains.
- Heating elements: Validating uniformity of transparent heater patterns (e.g., busbar-free silver mesh) for automotive HUDs or defogging windows.
FAQ
Does the SURAGUS 2530 require electrical contact with the sample?
No—it operates exclusively via non-contact eddy current induction and requires no electrodes, probes, or surface metallization.
Can it measure insulating or semi-conductive layers?
It measures only conductive films (σ > ~102 S/m). Dielectrics (e.g., SiO₂, Al₂O₃) and wide-bandgap semiconductors (e.g., ZnO without doping) yield no measurable eddy current response.
How is calibration performed?
Using certified reference standards traceable to PTB or NIST—typically thin-film Cr/Au or Ti/Pt on quartz, with nominal Rs values spanning 0.1–1000 Ω/□.
Is temperature compensation available?
Yes—optional integrated Pt100 sensor monitors ambient temperature near the sample stage; Rs values can be corrected to 23°C using material-specific TCR coefficients.
What file formats are supported for data exchange?
Native .sra project archives, plus export to CSV (tabular), GeoTIFF (georeferenced maps), PDF (report), and HDF5 (for MATLAB/Python analysis).


