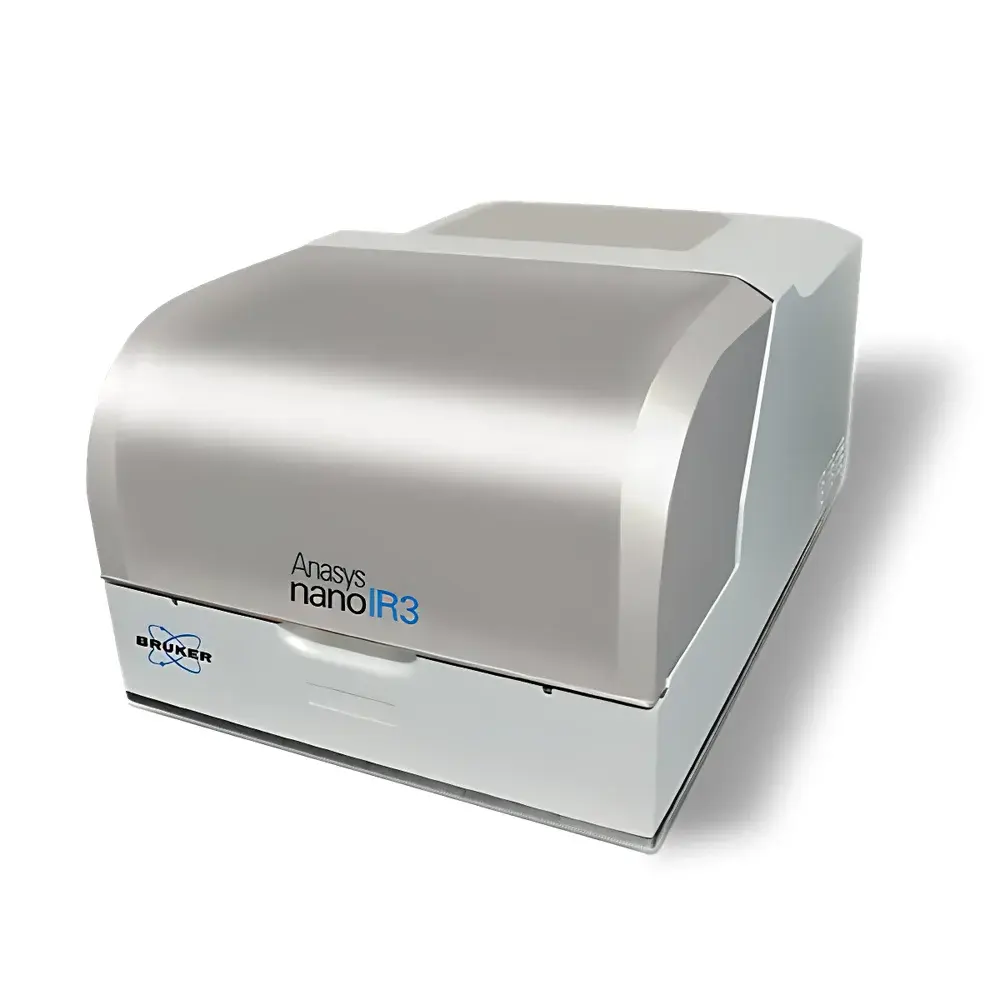
Bruker nanoIR3 Nano-FTIR Spectrometer
| Brand | Bruker |
|---|---|
| Origin | USA |
| Model | nanoIR3 |
| Instrument Type | Nano-Fourier Transform Infrared Spectrometer |
| Category | Scanning Probe Microscope–Integrated Optical Spectroscopy System |
| Compliance | ASTM E2947-21 (Standard Guide for Nanoscale Infrared Spectroscopy), ISO/IEC 17025–Accredited Measurement Capability Context |
Overview
The Bruker nanoIR3 is a commercially engineered nano-Fourier transform infrared (nano-FTIR) spectrometer that integrates scattering-type scanning near-field optical microscopy (s-SNOM) with broadband tunable infrared illumination and high-sensitivity interferometric detection. Unlike conventional FTIR, which is diffraction-limited to ~3–10 µm spatial resolution, the nanoIR3 achieves true nanoscale chemical mapping with <20 nm spatial resolution—enabled by atomic force microscope (AFM)-based tip-enhanced near-field interaction and heterodyne interferometric signal demodulation at the third harmonic (Ω + 3ω). This architecture permits label-free, non-destructive vibrational spectroscopy of heterogeneous materials at sub-10 nm lateral scales, making it indispensable for correlative nanoscale structure–function analysis in catalysis, polymer phase segregation, 2D material heterostructures, and pharmaceutical solid-state characterization.
Key Features
- Sub-20 nm spatial resolution IR spectroscopy enabled by s-SNOM with PtIr-coated AFM tips and phase-resolved interferometric detection
- Broadband mid-IR coverage (1000–4000 cm⁻¹) via tunable quantum cascade laser (QCL) and globar source options
- Simultaneous topographic, mechanical (phase, amplitude), and nanoscale IR absorption/reflectance mapping in a single scan
- Integrated Bruker Dimension Icon AFM platform with closed-loop XY stage (100 × 100 µm² range) and Z piezo scanner (15 µm range)
- Real-time spectral acquisition at up to 16 cm⁻¹ spectral resolution; full spectra collected per pixel in hyperspectral imaging mode
- Engineered for ultra-low drift and thermal stability: active vibration isolation, temperature-controlled sample stage (±0.1 °C), and vacuum-compatible optical path options
Sample Compatibility & Compliance
The nanoIR3 accommodates solid, flat, or gently curved samples up to 25 mm in diameter and 10 mm thick—including catalytic nanoparticles on TEM grids, thin-film polymer blends, exfoliated 2D crystals (e.g., MoS₂, h-BN), pharmaceutical co-crystals, and semiconductor heterostructures. Samples require no metal coating or conductive treatment. The system supports ambient, dry nitrogen purge, and low-vacuum (<10 mbar) environments to minimize atmospheric water vapor interference in the 1500–1800 cm⁻¹ region. From a regulatory standpoint, data acquisition workflows align with principles outlined in ASTM E2947-21 for nanoscale IR spectroscopy validation. While not a GMP instrument per se, its audit-trail-capable software (see Software section) supports GLP-compliant documentation when integrated into validated laboratory information management systems (LIMS). Full spectral metadata—including tip identity, laser power, demodulation order, and environmental conditions—is embedded in each .spm and .nir file per ISO/IEC 17025 traceability guidelines.
Software & Data Management
Control and analysis are performed using Anasys Instruments’ proprietary nanoIR3 Software Suite (v4.5+), built on a modular, scriptable Python API framework. Core modules include: RealTime Scan for synchronized AFM + IR acquisition; Hyperspectral Explorer for multivariate spectral clustering (PCA, MCR-ALS); Reference Library Match for automated functional group identification against NIST and commercial IR databases; and Quantitative Analysis Toolkit for peak area normalization, baseline correction, and line-profile extraction across arbitrary ROIs. All raw interferograms and demodulated spectra are stored in open-format HDF5 containers with embedded EXIF-style metadata. The software supports FDA 21 CFR Part 11–compliant user access control, electronic signatures, and immutable audit logs—including timestamped operator actions, parameter changes, and file exports—when deployed on Windows domain-joined systems with Group Policy enforcement.
Applications
- Catalysis: Spatially resolved mapping of surface adsorbates and reaction intermediates on individual nanoparticle facets (e.g., Pt edge vs. terrace reactivity toward N-heterocyclic carbene oxidation, as reported in Nature 541, 511–515, 2017)
- Polymers & Composites: Identification of nanoscale phase separation, filler dispersion homogeneity, and interfacial degradation in thermoplastic elastomers and carbon-fiber-reinforced resins
- 2D Materials: Layer-dependent phonon mode shifts, strain mapping, and defect-associated vibrational signatures in van der Waals heterostructures
- Pharmaceuticals: Polymorph distribution, hydrate/anhydrate interfaces, and excipient–API molecular interactions within micron-scale tablet cross-sections
- Electronics: Chemical identification of residue contaminants, interfacial interdiffusion, and dielectric layer integrity in advanced packaging substrates
FAQ
What is the minimum detectable absorbance change in nanoIR3 measurements?
The system achieves an effective absorbance sensitivity of ~10⁻⁴ AU under optimized conditions (high-reflectivity sample, QCL illumination, 1024 averages), limited primarily by detector NEP and tip scattering efficiency—not by the interferometer itself.
Can the nanoIR3 operate in liquid or electrochemical environments?
No. The current configuration requires air or inert gas purge/vacuum. Liquid-cell s-SNOM remains an active research frontier but is not supported by the production nanoIR3 platform.
Is spectral calibration traceable to NIST standards?
Yes. Wavelength calibration uses certified polystyrene film reference peaks (e.g., 1601 cm⁻¹ C=C stretch) and is verified annually using NIST-traceable gas cells (e.g., CO, N₂O) per internal SOP-IR-003.
How does nanoIR3 differ from AFM-IR (Photothermal Induced Resonance)?
nanoIR3 relies on scattering near-field detection (coherent, interferometric), offering superior signal-to-noise and quantitative linearity; AFM-IR uses photothermal expansion detection (incoherent, resonant), which is more sensitive to thermal properties but less directly quantitative for absorption cross-sections.


