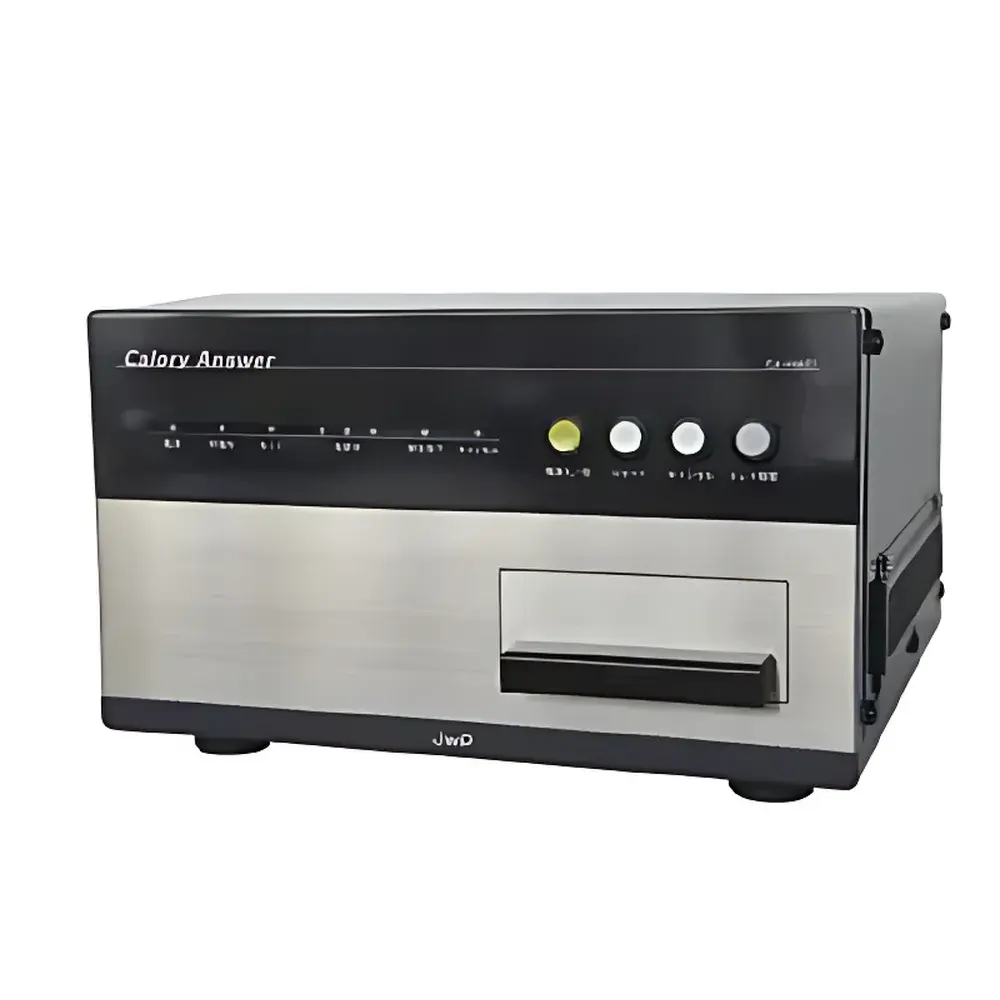
Calory Answer CA-HM Near Infrared Spectrometer for Food Calorie and Macronutrient Analysis
| Origin | Imported |
|---|---|
| Manufacturer Type | Authorized Distributor |
| Instrument Type | Laboratory-grade NIR Spectrometer |
| Model | CA-HM |
| Optical Design | Grating Scanning System |
| Wavelength Range | 780–2526 nm |
| Scan Speed | 100 scans per minute |
| Data Sampling Interval | 1 s |
| Measurement Modes | Reflectance & Transmission |
| Chemometric Algorithm | Peak Cross-Correlation Method |
| Application Scope | Academic Research, Food Quality Control, Nutrition Labeling, R&D Laboratories |
Overview
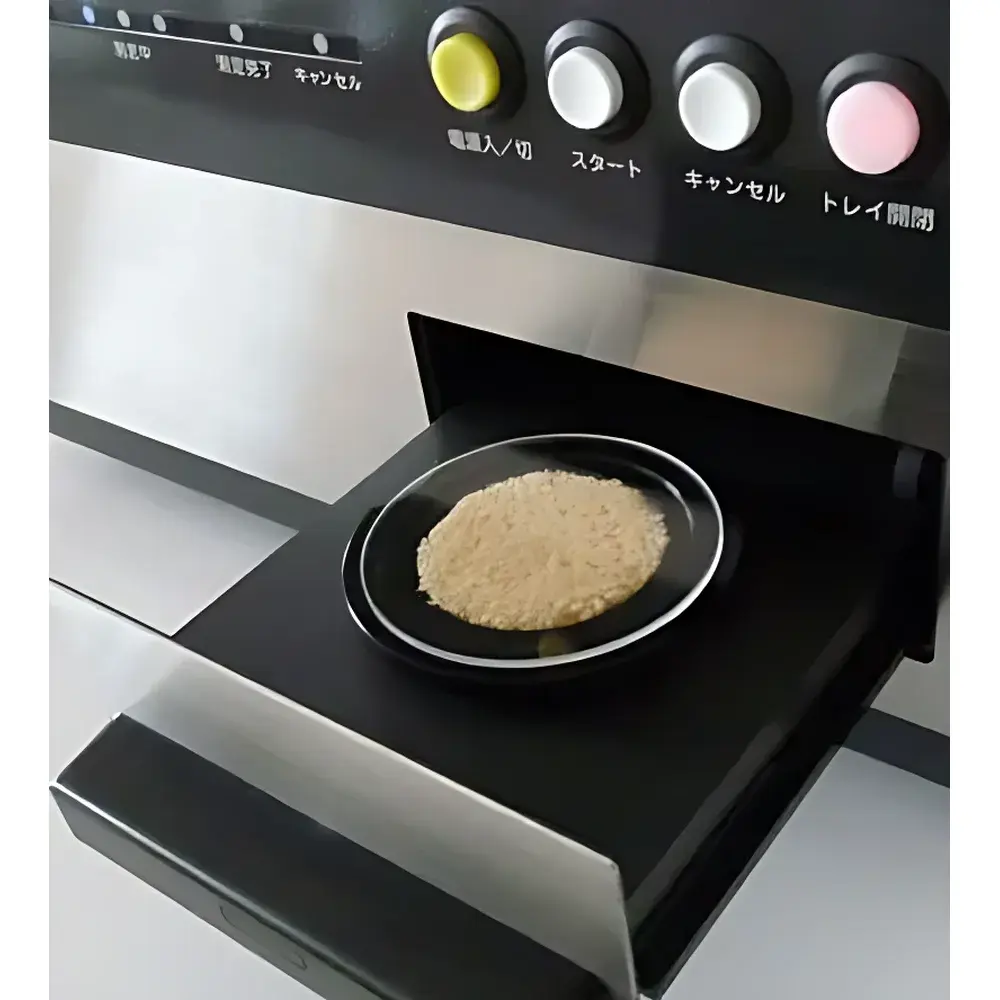
The Calory Answer CA-HM is a laboratory-grade near-infrared (NIR) spectrometer engineered for rapid, non-destructive quantification of caloric content and major macronutrients in diverse food matrices. Operating on the principle of grating-scanning NIR spectroscopy, the instrument captures absorption spectra across the 780–2526 nm spectral window—encompassing key overtones and combination bands of C–H, O–H, and N–H bonds. These spectral signatures are correlated to reference values via a robust chemometric engine based on peak cross-correlation methodology, enabling simultaneous prediction of gross energy (kcal/100 g), protein, fat, total carbohydrates, moisture, and ethanol content. Unlike classical wet-chemistry or bomb calorimetry methods—which require sample homogenization, reagent use, combustion, and multi-hour turnaround—the CA-HM delivers validated results in under five minutes without chemical consumption or sample preparation. Its dual-mode optical path supports both reflectance (for solids, powders, and prepared dishes) and transmission (for liquids, slurries, and semi-transparent samples), making it uniquely suited for heterogeneous, real-world food systems—including composite meals such as stir-fried dishes, stews, and ready-to-eat meals common in institutional and commercial food service environments.
Key Features
- Grating-scanning optical architecture ensures high wavelength accuracy and long-term photometric stability across the full 780–2526 nm range
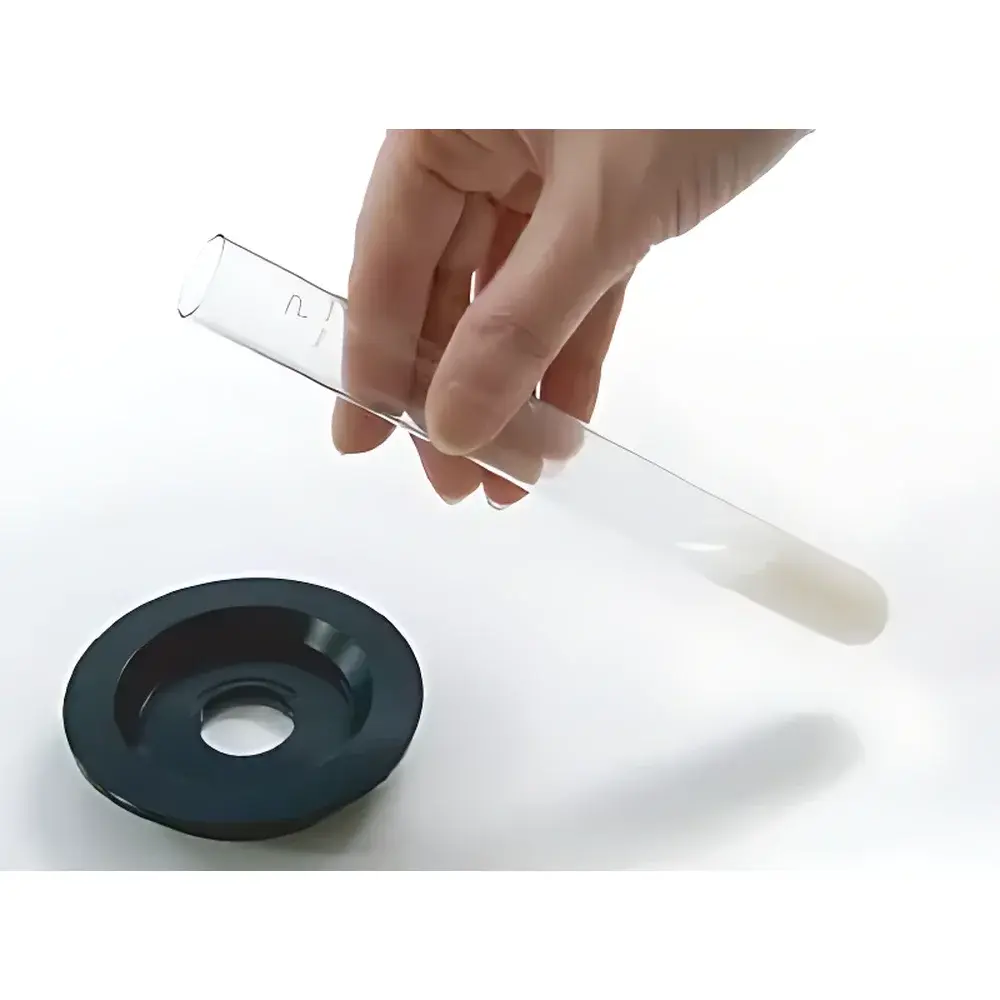
- Dual-path measurement capability: configurable reflectance probe for surface analysis and transmission cuvette holder for liquid/slurry analysis
- Automated calibration validation with built-in reference standards traceable to NIST-traceable SRMs
- Integrated chemometric engine implementing peak cross-correlation algorithm—optimized for food matrix complexity and inter-component spectral interference
- Pre-loaded spectral library containing >12,000 reference spectra from USDA SRD, AOAC-certified food categories, and regionally representative Asian cuisine formulations
- Compliance-ready data handling: audit trail logging, user access levels, electronic signature support, and export formats compatible with LIMS integration (CSV, XML, ASTM E1384-compliant)
- Modular design supporting future firmware upgrades for expanded analyte prediction models (e.g., fiber, sugar subtypes, allergens)
Sample Compatibility & Compliance
The CA-HM accommodates a broad spectrum of food physical states—solid, semi-solid, viscous, particulate, and liquid—without grinding, drying, or solvent extraction. Validated applications include raw ingredients (grains, meats, dairy), processed foods (baked goods, snacks, sauces), and complex multi-component meals (e.g., rice bowls, noodle soups, dim sum). All predictive models are developed and verified per AOAC Official Method 2019.01 (NIR for Food Macronutrients) and ISO 12099:2017 (Cereals and Pulses – Determination of Protein, Moisture, and Starch by NIR). The system meets GLP requirements for method validation documentation, including linearity (R² ≥ 0.992), repeatability (RSD < 1.8% for kcal), and intermediate precision (RSD < 2.5% across operators/days). Instrument qualification follows IQ/OQ protocols aligned with FDA 21 CFR Part 11 for electronic records and signatures.
Software & Data Management
CA-HM operates via CalorySuite v4.2—a Windows-based application compliant with FDA 21 CFR Part 11 Annex 11 and EU GMP Annex 11. The software provides full lifecycle management: method creation, spectral acquisition, model selection, result review, trend analysis, and report generation (PDF, Excel, XML). Each measurement session automatically logs operator ID, timestamp, instrument configuration, raw spectrum, and residual error metrics. Data export supports ASTM E1384 (Standard Guide for Computerized Data Acquisition in Clinical and Laboratory Settings) and HL7 FHIR-compliant nutrition data structures. Remote diagnostics and secure cloud backup (optional) enable centralized fleet monitoring for multi-site laboratories.
Applications
- Nutrition labeling compliance for FDA, EFSA, and China GB 28050–2011 regulatory submissions
- Rapid QC screening of incoming raw materials and finished products in food manufacturing
- Menu engineering and calorie verification in hospital, school, and corporate catering operations
- Research on nutrient retention during thermal processing, fermentation, or storage
- Development and validation of low-calorie, high-protein, or low-carb food formulations
- Teaching and method validation in university food science and analytical chemistry laboratories
FAQ
Does the CA-HM require daily recalibration with physical standards?
No—routine calibration is maintained via internal reference checks every 30 minutes; full performance verification with certified reference materials is recommended weekly or after environmental shifts exceeding ±2°C.
Can the instrument quantify individual sugars (e.g., glucose, fructose) or only total carbohydrates?
The standard CA-HM configuration reports total carbohydrates; optional add-on models trained on HPLC-validated datasets support sucrose, lactose, and maltose differentiation (requires separate method validation).
Is method transfer possible between different CA-HM units?
Yes—spectral data and chemometric models are fully portable across CA-HM instruments using the same grating and detector configuration; inter-unit bias is typically <0.8% for kcal prediction when operated under identical ambient conditions.
What sample volume or mass is required for transmission vs. reflectance mode?
Transmission: 2–5 mL liquid or slurry in standard 10-mm quartz cuvettes; Reflectance: ≥5 cm² surface area with minimum thickness of 3 mm for solid samples.
How is the “peak cross-correlation” algorithm different from PLS regression?
Peak cross-correlation prioritizes localized spectral feature alignment over global variance capture, improving robustness against baseline drift and particle size effects—particularly advantageous for unprocessed or minimally homogenized food samples.
Related Products


")