EcoTech PhenoTron® Conveyor-Based High-Throughput Plant Phenotyping Imaging Platform
| Brand | EcoTech |
|---|---|
| Origin | Beijing, China |
| Model | PhenoTron® Conveyor-Based |
| Imaging Modalities | Hyperspectral (400–1000 nm & 900–1700 nm), Chlorophyll Fluorescence Imaging, Thermo-RGB Fusion Imaging |
| Conveyor System | Motorized roller conveyor with PTS (Precision Transport & Stabilization) technology |
| Control Interface | Embedded 10-inch touchscreen HMI + PC-based GUI software |
| Data Acquisition | IoT star-network architecture supporting up to 250 load cells |
| Optional Modules | Automated irrigation chamber, UV excitation light source (long-wave), linear solar-spectrum white light source |
| Software Suite | SpectrAPP (hyperspectral analysis), FluorVision (chlorophyll fluorescence quantification) |
| Compliance | Designed for GLP-compliant phenotyping workflows |
Overview
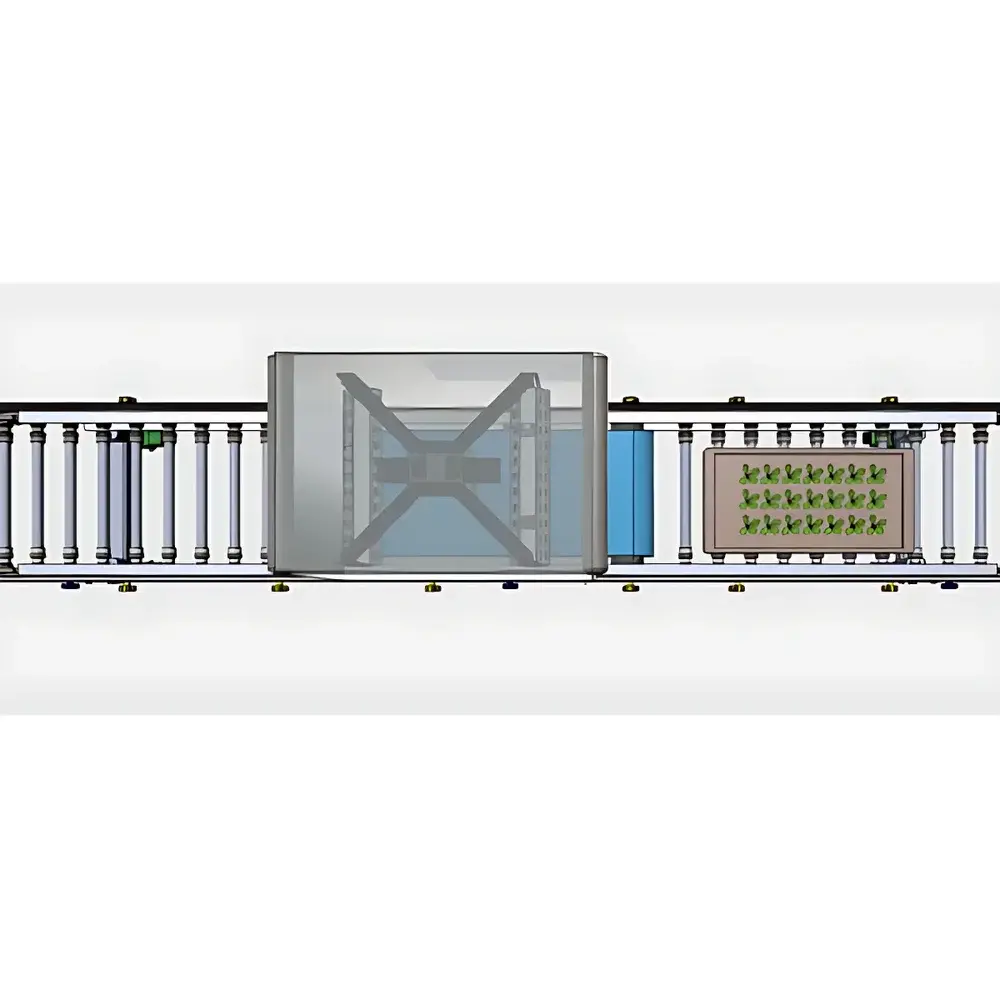
The EcoTech PhenoTron® Conveyor-Based High-Throughput Plant Phenotyping Imaging Platform is an integrated, non-invasive measurement system engineered for longitudinal, quantitative plant phenotyping under controlled or semi-controlled environments—including growth chambers, greenhouses, and dedicated phenotyping laboratories. It operates on the principle of automated, repeatable sample positioning via a precision-engineered roller conveyor system combined with PTS (Precision Transport & Stabilization) technology—ensuring minimal mechanical disturbance while maintaining sub-millimeter positional repeatability across successive imaging cycles. The platform synchronizes multi-modal optical sensing—including hyperspectral reflectance (400–1000 nm and 900–1700 nm), modulated chlorophyll fluorescence kinetics (OJIP and steady-state protocols), and thermal-RGB fusion imaging—to capture structural, biochemical, physiological, and biophysical traits across the entire plant life cycle. Its modular architecture enables scalable deployment: from single-plant validation studies to population-level screening of hundreds of genotypes per day.
Key Features
- PTS-integrated motorized roller conveyor system with customizable belt dimensions and speed control (0.1–10 cm/s), enabling stable, vibration-damped transport of diverse plant containers including EcoTech’s patented iPOT lysimeters and standard growth pots.
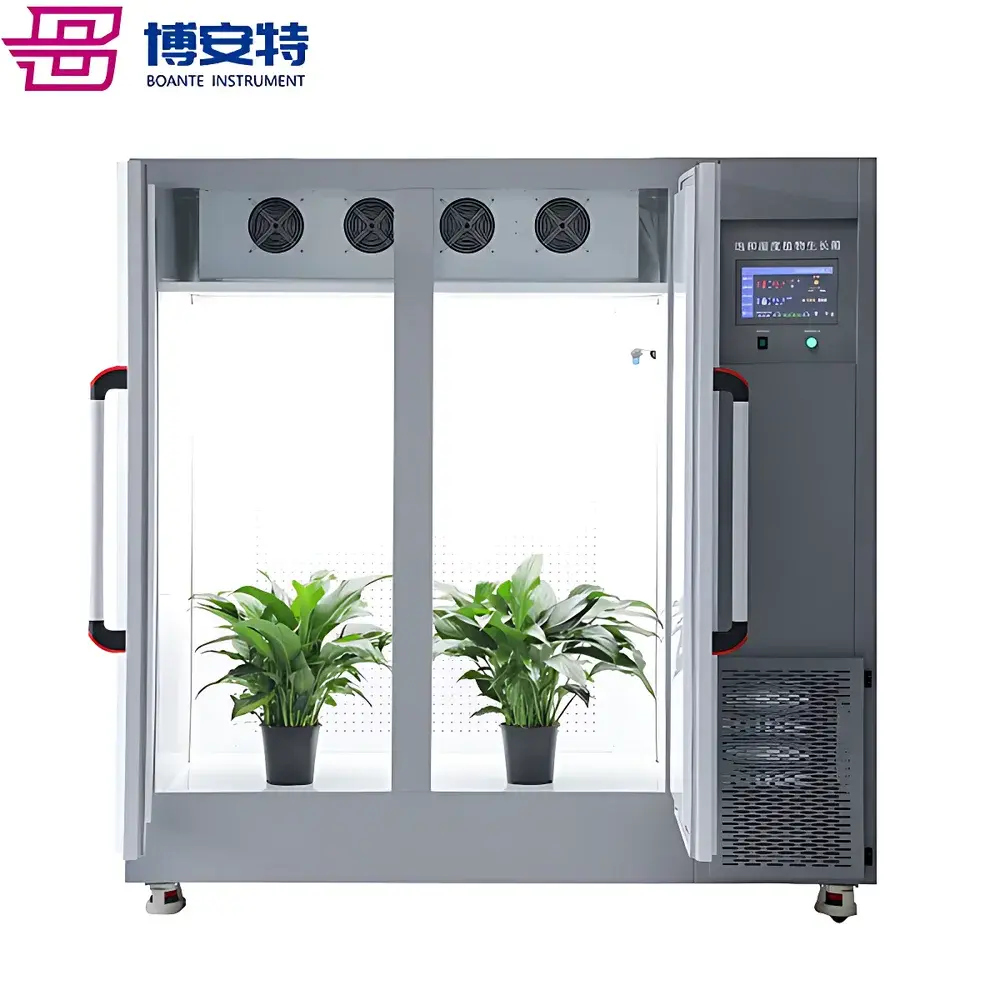
- Dedicated dark-adapted imaging chamber with uniform, stray-light-isolated illumination geometry—featuring symmetrically adjustable solar-spectrum linear LED arrays and long-wave UV excitation sources (365 nm ± 5 nm) for standardized fluorescence induction.
- Embedded industrial-grade controller with 10-inch capacitive touchscreen HMI running a real-time Linux OS; supports bilingual (English/Chinese) GUI navigation and local operation without external PC dependency.
- Iot-enabled star-topology sensor network architecture, compatible with up to 250 calibrated load cells for high-resolution gravimetric phenotyping—enabling automated water-use efficiency (WUE), transpiration rate, and biomass accumulation tracking synchronized with spectral acquisitions.
- Modular expansion capability: optional irrigation chamber integrates programmable per-pot dosing of water, nutrients, or agrochemicals with µL-level volumetric accuracy and timestamped event logging.
Sample Compatibility & Compliance
The PhenoTron® platform accommodates a broad range of plant growth systems, including but not limited to EcoTech’s iPOT soil-plant-atmosphere continuum (SPAC) lysimeters, 96-well tray systems, hydroponic rafts, and standard 10–20 cm diameter pots. All imaging protocols are designed to meet reproducibility requirements outlined in ISO 22237-3 (Plant Phenotyping—Part 3: Imaging Standardization) and align with FAIR (Findable, Accessible, Interoperable, Reusable) data principles. Raw image datasets retain embedded EXIF metadata—including exposure time, gain, lens focal length, sensor temperature, and illumination intensity—for traceability. Spectral calibration adheres to NIST-traceable standards using certified reflectance panels and fluorescence reference standards. Data acquisition logs comply with ALCOA+ (Attributable, Legible, Contemporaneous, Original, Accurate, Complete, Consistent, Enduring, Available) criteria for GLP/GCP environments.
Software & Data Management
SpectrAPP and FluorVision constitute the dual-core analytical suite. SpectrAPP provides pixel-wise spectral unmixing, ROI-based region-of-interest segmentation, geometric area normalization, spectral derivative computation, and automated peak detection across user-defined bands. It implements partial least squares regression (PLSR), random forest, and support vector machine (SVM) models for predictive trait mapping—including nitrogen status, drought response indices, and pathogen susceptibility scores. FluorVision delivers kinetic parameter extraction (Fv/Fm, ΦPSII, NPQ, qP), spatial heterogeneity mapping of fluorescence yield, and temporal trend analysis across multi-day experiments. Both applications generate audit-trail reports compliant with FDA 21 CFR Part 11 requirements—including electronic signatures, version-controlled processing scripts, and immutable raw-data archiving in HDF5 format.
Applications
- High-throughput screening of genetic diversity panels for abiotic stress resilience (drought, salinity, heat) via Tc-Ta differentials, PRI dynamics, and stomatal conductance proxies.
- Quantitative assessment of foliar nitrogen status using DCNI, NDNI, and TCARI1510 indices calibrated against Kjeldahl digestion reference data.
- Early detection of biotic stressors—including fungal infection and herbivory—through spectral shifts in carotenoid-to-chlorophyll ratios (e.g., CRI550_515), anthocyanin accumulation (ARI, CTRI), and fluorescence quenching patterns.
- Longitudinal monitoring of canopy architecture development using morphometric parameters: projected leaf area index (LAI), convex hull area, compactness ratio, and relative biomass accumulation derived from RGB-Thermal fusion masks.
- Integration with eco-physiological modeling frameworks such as APSIM and STICS via standardized NetCDF output exports for scaling from plot-level observations to field-scale predictions.
FAQ
Can the PhenoTron® platform be operated in ambient greenhouse lighting conditions?
Yes—the imaging chamber provides full optical isolation, and all active illumination sources are intensity-stabilized and spectrally characterized, eliminating dependence on ambient light.
Is remote operation supported over institutional networks?
Yes—GUI software supports secure TCP/IP communication with TLS encryption; platform status, queue management, and live preview streaming are accessible via authenticated web interface.
How is calibration maintained across extended deployments?
Daily automated dark-current and white-reference acquisitions are scheduled; spectral response drift is tracked using onboard photodiode arrays and corrected via polynomial interpolation in SpectrAPP.
Does the system support third-party sensor integration?
Yes—RS485, CAN bus, and Modbus TCP interfaces are available for integrating environmental sensors (VWC, PAR, CO₂), robotic arms, or custom actuators.
What file formats are generated during acquisition?
Hyperspectral cubes (.hdr/.env), fluorescence time-series (.csv), thermal-RGB overlays (.tiff), and structured metadata (.json) are exported simultaneously; batch conversion to NetCDF4 is scriptable via Python API.