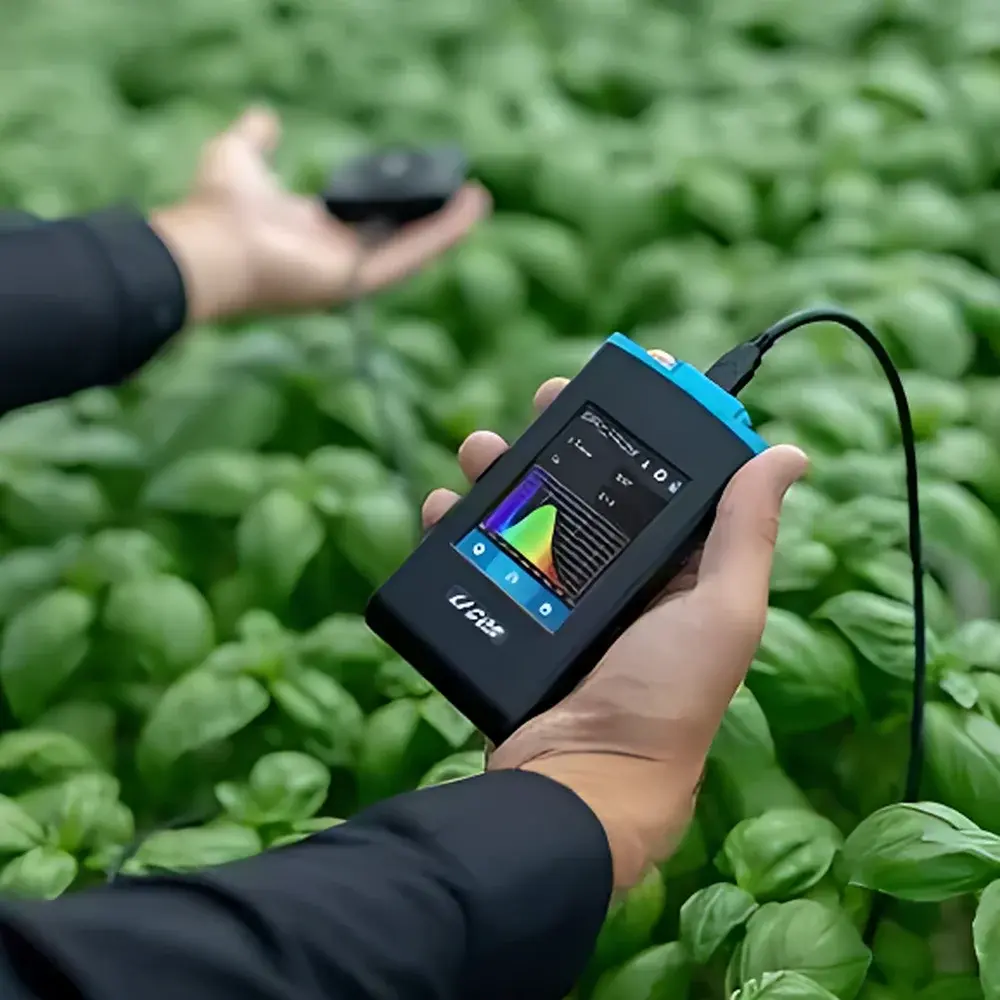
LI-COR LI-180 Spectral Quantum Meter for Plant Lighting
| Brand | LI-COR |
|---|---|
| Origin | USA |
| Model | LI-180 |
| Spectral Range | 380–780 nm |
| Wavelength Resolution | 1 nm (FWHM ≈ 12 nm) |
| Measurement Parameters | PPFD (1–3,000 µmol·m⁻²·s⁻¹), Irradiance (0.5–1,000 W·m⁻²), Illuminance (70–150,000 lx) |
| Detector | CMOS linear image sensor with cosine-corrected optical input |
| Display | 3.5″ 320×420 touchscreen LCD |
| Data Storage | 8 GB SD card (up to 68,000 files) |
| Battery Life | 5 h continuous operation (2500 mAh Li-ion) |
| Accuracy | PPFD ±5%, Illuminance ±5%, Chromaticity (x,y) ±0.0025, CCT ±2%, CRI (Ra) ±1.5% |
| Compliance | JIS C 1609-1:2006 Class AA, DIN 5032-7 Class B |
| Interface | Mini USB 2.0, Wi-Fi SD card, microSD (up to 32 GB) |
| Output Formats | .txt, .jpg |
| Operating Temperature | 0–35 °C |
| Dimensions | 200 × 77 × 26 mm |
| Weight | 0.28 kg |
Overview
The LI-COR LI-180 Spectral Quantum Meter is a field-deployable, high-fidelity spectroradiometer engineered specifically for horticultural lighting analysis and photobiological research. Unlike broadband quantum sensors or generic illuminance meters, the LI-180 employs a calibrated CMOS linear image sensor coupled with a precision diffraction grating to resolve spectral photon flux density across the biologically critical range of 380–780 nm at 1-nm nominal intervals. Its optical design incorporates rigorous cosine correction—validated per JIS C 1609-1:2006 (Class AA) and DIN 5032-7 (Class B)—ensuring angular response fidelity under non-normal incidence, essential for accurate canopy-level or fixture-level measurements in vertical farms, growth chambers, and greenhouse environments. The instrument quantifies photosynthetically active radiation (PAR) as wavelength-resolved photosynthetic photon flux density (PPFD), while simultaneously computing irradiance (W·m⁻²), illuminance (lx), chromaticity coordinates (CIE 1931 and 1976), correlated color temperature (CCT), and general/specialized color rendering indices (CRI Ra–R15). This multi-parameter spectral capability enables researchers and lighting engineers to move beyond integrated metrics and interrogate the functional impact of spectral composition on photoreceptor activation—particularly phytochrome (Pr/Pfr), cryptochrome, and phototropin responses—thereby supporting evidence-based lighting protocol development.
Key Features
- Single-button acquisition of full-spectrum data (380–780 nm) with 1-nm wavelength resolution and ~12 nm spectral bandwidth (FWHM)
- Real-time calculation of PAR-weighted PPFD, total PFD, irradiance, illuminance, CCT, CRI, and CIE chromaticity (x,y, u′,v′, Duv)
- Built-in reference spectra for 12 plant pigments—including chlorophyll a/b, carotenoids, anthocyanins, and phytochromes—to support spectral matching and action spectrum modeling
- Configurable band ratio analysis: user-defined integration bands (e.g., R:FR, B:R, UV-B:PAR) with instantaneous ratio computation and logging
- Integrated 3.5″ high-contrast touchscreen display with multilingual UI (English, Spanish, French, German, Simplified/Traditional Chinese, Japanese, Italian, Russian)
- Onboard storage (8 GB SD card, ≥68,000 spectra) and dual-mode connectivity: Wi-Fi SD card for iOS/Android transfer and Mini USB 2.0 for PC tethering
- Robust portable form factor (200 × 77 × 26 mm; 0.28 kg) with IP-rated housing suitable for humid (0–95% RH, non-condensing) and temperature-controlled (0–35 °C) cultivation environments
Sample Compatibility & Compliance
The LI-180 is designed for direct measurement of artificial light sources used in controlled-environment agriculture—including LED arrays, fluorescent tubes, ceramic metal halide (CMH), and plasma lamps—as well as natural daylight under filtered or unfiltered conditions. It does not require external calibration standards during routine use due to factory traceable NIST-calibrated responsivity. Its spectral accuracy (±5% PPFD, ±2% CCT, ±1.5% CRI Ra) and chromaticity repeatability (2σ: Δx,y ≤ 0.0005) meet requirements for GLP-aligned experimental documentation and lighting validation per ASABE S640.1 and ISO 11664-1:2019. The device supports audit-ready data capture with timestamped metadata (GPS optional via mobile app), integral logging intervals (1 s to 24 h), and exportable .txt spectral power distribution (SPD) files compatible with third-party photobiological modeling tools (e.g., Photobiology R package, LightSim).
Software & Data Management
Data acquisition and analysis are supported through two interoperable platforms: the LI-180 Mobile App (iOS and Android) and the desktop LI-180 PC Software. The mobile application enables real-time visualization, email-based file transmission, geotagging, and immediate comparison against built-in spectral templates (e.g., “Sunlight”, “White LED”, “Red+Blue Horti-LED”). The PC software provides advanced post-processing: batch spectral normalization, derivative analysis, peak wavelength (λp) and dominant wavelength (λd) extraction, excitation purity mapping, and time-series trending of PPFD decay or spectral shift—critical for lamp aging studies and maintenance scheduling. All exported data include embedded calibration coefficients and comply with FDA 21 CFR Part 11 requirements when used with validated electronic signatures and audit trails in regulated GMP horticulture facilities.
Applications
The LI-180 serves as a foundational metrology tool across commercial and academic plant science domains. It is routinely deployed to validate spectral output consistency across LED manufacturing lots; quantify photometric drift in aging fixtures over 10,000+ operational hours; optimize supplemental lighting recipes for specific cultivars (e.g., high-blue for compact lettuce morphology, elevated far-red for stem elongation control); assess spectral uniformity across multi-tier vertical farm racks; and correlate lighting parameters with physiological endpoints such as stomatal conductance, anthocyanin accumulation, or flowering time. Its ability to resolve narrowband UV-A (380–400 nm) and far-red (700–780 nm) contributions supports emerging research into UV-mediated secondary metabolite synthesis and phytochrome-mediated shade avoidance responses.
FAQ
Does the LI-180 require annual recalibration?
No—factory calibration is stable for typical field use over 24 months; however, users operating in extreme thermal cycling or high-UV exposure environments may elect biannual verification using LI-COR’s traceable calibration service.
Can the LI-180 measure pulsed or modulated LED signals?
Yes—the instrument supports integration times from 2 ms to 2000 ms and captures stable averages of flickering sources when configured in manual I-Time mode; it is not intended for high-frequency transient analysis (>1 kHz).
Is spectral data compatible with USDA-ARS or NASA Crop Growth Chamber databases?
Yes—exported .txt SPD files follow columnar ASCII format (wavelength [nm], irradiance [mW·m⁻²·nm⁻¹]) aligned with ASTM E308-19 and widely ingested by federal agricultural modeling pipelines.
How is cosine correction validated across the full 380–780 nm range?
Each unit undergoes goniophotometric characterization at 12 discrete wavelengths (380, 450, 530, 660, 730 nm, etc.) per CIE 127:2007 Annex B, with angular deviation < ±2% up to 75° off-axis.
Can custom spectral weighting functions be loaded?
Not directly onboard—but raw SPD data can be reprocessed externally using user-defined action spectra (e.g., McCree curve, EN 13032-4 phytochrome-weighted irradiance) via Python/Matlab scripts or LI-COR’s licensed spectral analysis toolkit.
Related Products


")