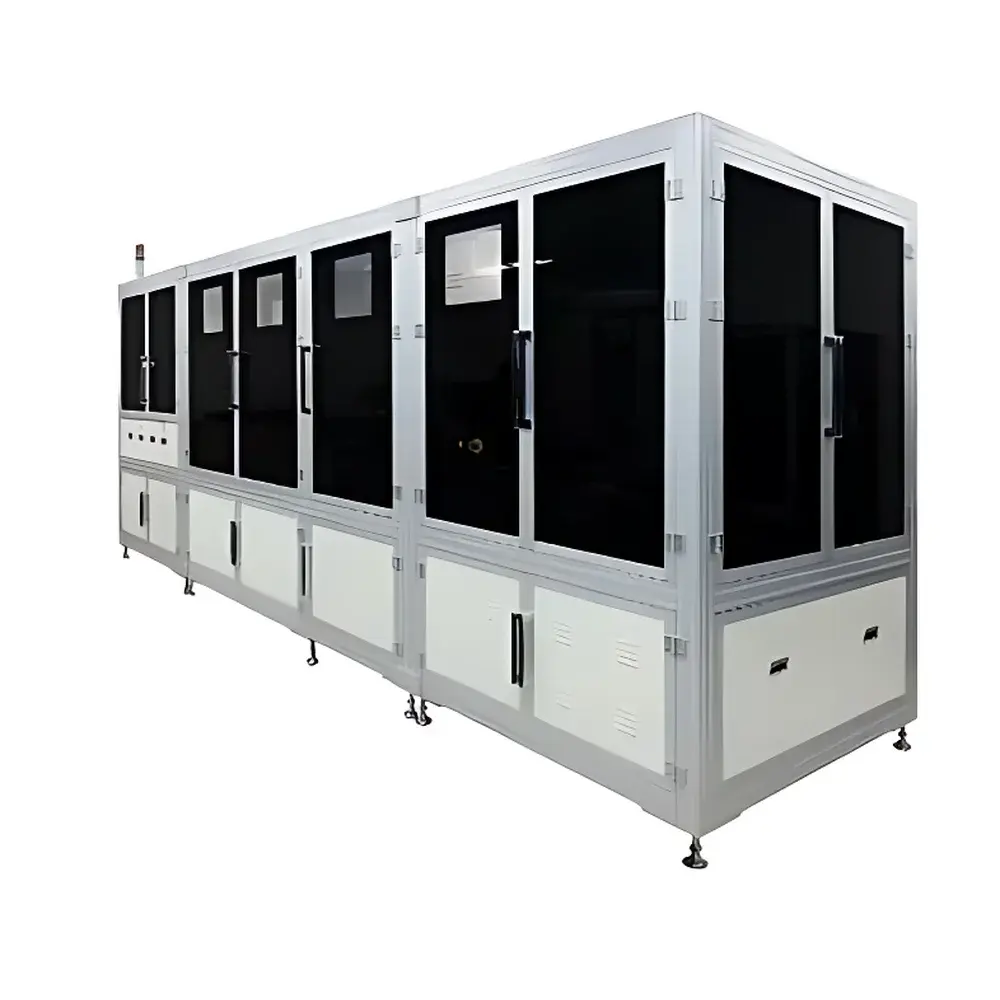
McScience K3500 In-Line Solar Cell Inspection and Sorting System
| Brand | McScience |
|---|---|
| Origin | South Korea |
| Model | K3500 |
| Application | In-line I-V characterization, electroluminescence (EL) / photoluminescence (PL) imaging, automated optical inspection (AOI), micro-crack & hot-spot detection |
| Compliance | Designed for ISO 9001-certified PV manufacturing environments |
| Control Interface | Touch-enabled HMI with recipe-based operation |
| Throughput | Up to 6,000 wafers/hour (standard 156.75 mm × 156.75 mm M2 cells) |
| Integration | Compatible with standard conveyor-based inline PV production lines (SECS/GEM optional) |
Overview
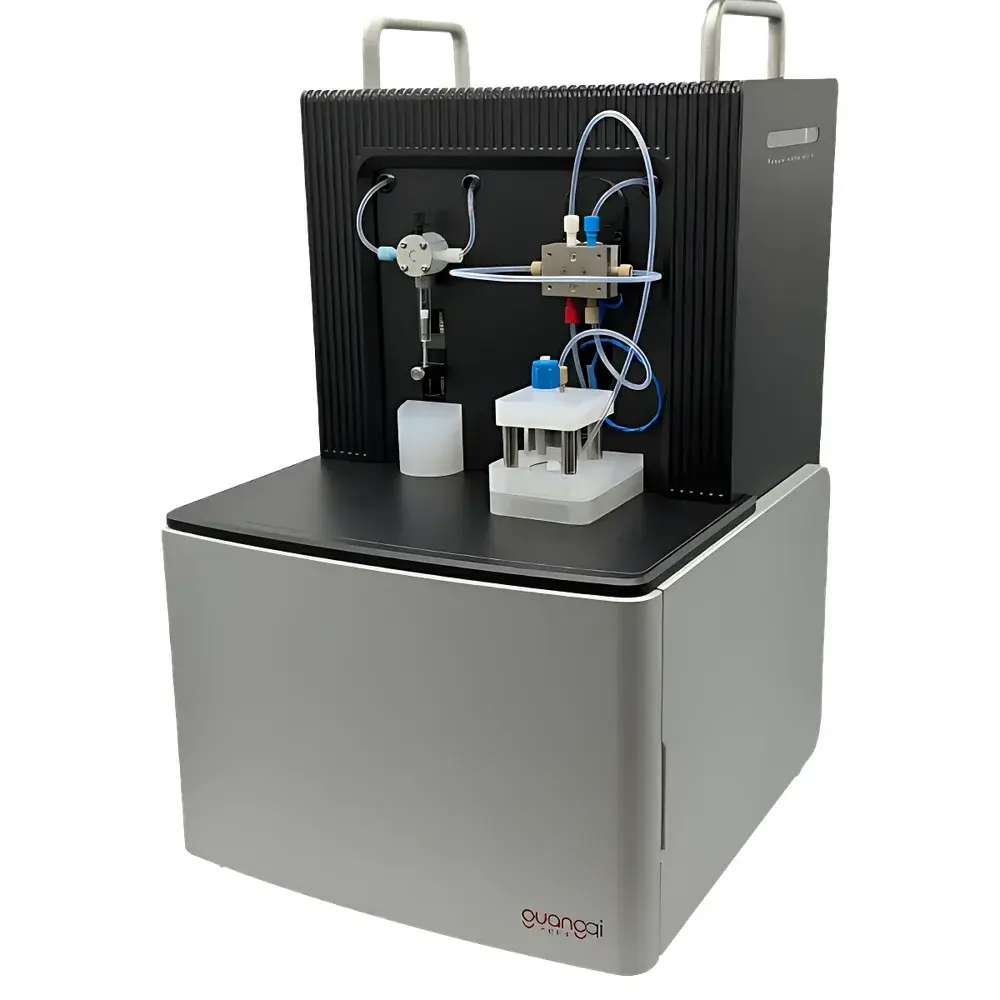
The McScience K3500 In-Line Solar Cell Inspection and Sorting System is an integrated metrology platform engineered for real-time electrical and optical characterization of silicon photovoltaic (PV) cells during high-volume manufacturing. Built upon a modular architecture, it combines synchronized current–voltage (I-V) curve tracing under calibrated flash illumination with high-resolution monochrome and multispectral imaging modalities—including electroluminescence (EL), photoluminescence (PL), and automated optical inspection (AOI). The system operates in continuous motion mode or indexed stop-and-measure mode, enabling full parametric mapping (e.g., Isc, Voc, FF, Pmax, series/shunt resistance, relative efficiency) alongside spatial defect localization (micro-cracks, broken fingers, shunts, dark regions, hot spots) without interrupting line throughput. Its design adheres to the physical constraints and environmental requirements of Class 10,000 cleanroom-compatible PV fabrication lines, supporting both PERC, TOPCon, and heterojunction (HJT) cell architectures.
Key Features
- Multi-modal inline inspection: Simultaneous acquisition of I-V data, EL/PL intensity maps, and AOI-based surface defect classification within a single pass
- Calibrated flash I-V measurement: Integrated pulsed xenon light source with NIST-traceable irradiance monitoring (1000 W/m² ±1%, AM1.5G spectrum), temperature-compensated sensor array (±0.5°C accuracy)
- High-speed imaging subsystem: 12-bit CMOS camera (4096 × 3072 px) with motorized zoom lens, programmable exposure control, and LED-based uniform backlighting for contrast-enhanced vision analysis
- Fully automated sorting logic: Rule-based or machine learning–assisted decision engine classifies cells into ≥8 predefined bins based on user-defined pass/fail thresholds per parameter
- Modular expansion capability: Optional plug-in modules include spectral response (QE/IPCE) mapping, laser-induced breakdown spectroscopy (LIBS) for metallization analysis, and thermal imaging for contact resistance evaluation
- Robust mechanical integration: Standardized mechanical interface (ISO 15706-compliant flange mounts), SECS/GEM communication protocol support, and ESD-safe handling components (surface resistivity <1×10⁶ Ω/sq)
Sample Compatibility & Compliance
The K3500 accommodates standard square and pseudo-square silicon wafers from 156.75 mm × 156.75 mm (M2) up to 210 mm × 210 mm (G12), including thin-wafer variants down to 130 µm thickness. It supports both front-contact and bifacial cell configurations with adjustable electrode contact pressure (0.1–2.0 N) and vacuum-assisted wafer stabilization. All optical and electrical measurements comply with IEC 60904-1, IEC 60904-9 (Class AAA solar simulator requirements), and ASTM E1036 for PV device performance testing. Data integrity and audit readiness are ensured via built-in GLP/GMP-aligned features: electronic signatures, 21 CFR Part 11–compliant audit trails, and encrypted database logging with timestamped metadata (including ambient temperature, humidity, and lamp calibration history).
Software & Data Management
The K3500 runs McScience’s proprietary PVInsight™ software suite, a Windows-based application with dual-mode operation: operator-guided workflow (with intuitive touch-HMI) and fully automated recipe-driven execution. Measurement data—including raw I-V curves, pixel-level EL intensity matrices, and AOI defect coordinates—are stored in HDF5 format with embedded metadata per EN 61215-2 and IEC 61730-2 traceability requirements. Statistical process control (SPC) dashboards generate real-time X-bar/R charts, capability indices (Cp/Cpk), and Pareto analysis of defect categories. Raw datasets export seamlessly to MATLAB, Python (via h5py), or enterprise MES systems via OPC UA or RESTful API. Software validation documentation (IQ/OQ/PQ protocols) is provided for regulated PV module manufacturing facilities.
Applications
- Inline quality gate at cell interconnection stage to prevent defective units from entering stringing/lamination
- Process feedback loop for diffusion, passivation, and metallization steps via correlation of EL contrast ratios with sheet resistance uniformity
- Root cause analysis of yield loss using spatially resolved Isc mapping and finger continuity metrics
- Reliability screening: Detection of latent micro-cracks induced by soldering stress or tabbing force via post-lamination EL retest
- Technology transfer support: Benchmarking new cell designs (e.g., tunnel oxide passivated contacts) against baseline performance distributions
- Third-party certification lab use: Pre-shipment verification per UL 1703 or IEC 61215-2 MQT 03/07 test sequences
FAQ
What cell formats and thicknesses does the K3500 support?
Standard configurations cover 156.75 mm to 210 mm square wafers, with minimum thickness support down to 120 µm. Custom end-effectors and vacuum chucks are available for ultra-thin or kerfless wafers.
Can the system integrate with existing factory automation infrastructure?
Yes — the K3500 supports SECS/GEM (SEMI E30/E37), OPC UA, and Modbus TCP protocols. PLC-level handshaking for start/stop, reject signal output, and bin assignment is configurable via onboard I/O terminal block.
How is measurement repeatability ensured across shifts and operators?
Automated daily self-calibration routines verify flash lamp spectral match, camera gain stability, and probe contact resistance. All calibrations are logged with digital signatures and version-controlled firmware.
Is EL imaging performed under forward bias or reverse bias conditions?
Both modes are supported: forward-bias EL (0.5–2.0 A typical) for junction quality assessment, and reverse-bias EL (up to 15 V) for leakage path identification and edge isolation verification.
Does the system provide raw data access for custom algorithm development?
Yes — full-resolution HDF5 datasets (including unprocessed frame stacks and time-synchronized analog I-V waveforms) are accessible via secure network share or local USB 3.2 export, with documented schema and unit definitions.