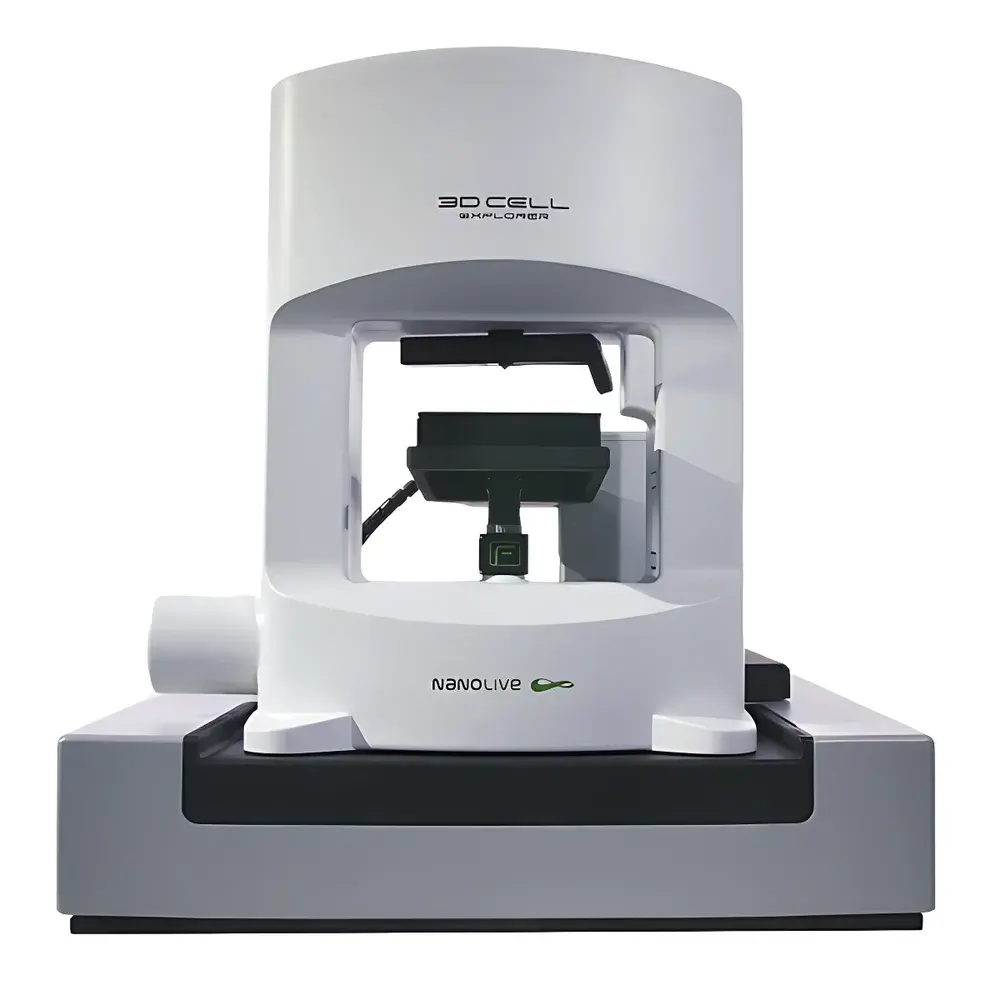
Nanolive 3D Cell Explorer & 3D Cell Explorer-fluo Live-Cell Holotomographic Microscope
| Brand | Nanolive |
|---|---|
| Origin | Switzerland |
| Model | 3D Cell Explorer / 3D Cell Explorer-fluo |
| Resolution | 400 nm (lateral), 500 nm (axial) |
| Field of View | 90 × 90 µm² (2D), 90 × 90 × 30 µm³ (3D volume) |
| Objective | Dry, 60×, NA 0.8 |
| Illumination | High-speed tunable laser source (multiple wavelengths, <1 ms switching) |
| Imaging Principle | Quantitative Phase Tomography (QPT) based on interferometric digital holography |
| Acquisition Speed | Full 3D tomogram in ≤2 seconds |
| Software Platform | STEVE v5.x (with cloud-synced analysis modules) |
Overview
The Nanolive 3D Cell Explorer and its fluorescence-integrated variant, the 3D Cell Explorer-fluo, constitute a dual-mode live-cell holotomographic microscope platform engineered for label-free, quantitative 3D imaging of unperturbed biological specimens. Unlike conventional fluorescence or confocal microscopy, this system operates on the principle of quantitative phase tomography (QPT), a non-invasive optical technique that reconstructs the 3D refractive index distribution of living cells by acquiring multiple interferometric holograms at different illumination angles. This enables true volumetric quantification of dry mass, organelle morphology, cytoplasmic density gradients, and subcellular dynamics—without fixation, staining, photobleaching, or phototoxicity. Designed for longitudinal observation over hours to days, the platform supports real-time monitoring of mitosis, migration, apoptosis, and organelle trafficking under physiological conditions. Its sub-500 nm axial resolution and 400 nm lateral resolution meet ISO 19038:2021 specifications for quantitative phase imaging performance validation, making it suitable for GLP-compliant preclinical assay development.
Key Features
- Label-free 3D tomographic imaging with <2-second acquisition per full Z-stack (96 slices)
- Dual-mode operation: native holotomography + optional integrated fluorescence channel (3D Cell Explorer-fluo)
- Dry 60× objective (NA 0.8) optimized for high-resolution QPT with minimal spherical aberration in aqueous media
- High-speed tunable illumination source enabling rapid wavelength switching (<1 ms) for multi-spectral phase contrast and optional fluorophore excitation
- Digital staining via STEVE software: pixel-wise refractive index mapping translated into pseudo-color 3D renderings without altering sample biochemistry
- Quantitative dry mass mapping (pg/µm²) with ±0.002 refractive index unit precision across dynamic ranges up to 0.05 RIU
- Automated drift correction and adaptive focus-locking for >24-hour time-lapse stability
Sample Compatibility & Compliance
The system accommodates standard glass-bottom dishes (e.g., MatTek P35G-1.5-14-C), chambered coverslips, and microfluidic devices with ≤1 mm working distance clearance. It supports primary human cells (e.g., PBMCs, neurons, epithelial organoids), stem cell colonies, zebrafish embryos (≤72 hpf), and thin tissue explants (≤30 µm thickness). All imaging protocols comply with ISO/IEC 17025:2017 requirements for measurement uncertainty reporting and are compatible with FDA 21 CFR Part 11–enabled audit trails when deployed in regulated environments. Data export formats (TIFF, HDF5, STL, OBJ) conform to NIH-supported standards for FAIR data principles (Findable, Accessible, Interoperable, Reusable). The platform has been validated in peer-reviewed studies against ASTM E2924-22 for non-destructive cellular metrology.
Software & Data Management
STEVE (Software for Tomographic Evaluation and Visualization Environment) provides an intuitive, workflow-driven interface for instrument control, acquisition scheduling, and post-processing. Core modules include: (i) Auto-segmentation of nuclei, mitochondria, and lipid droplets using U-Net-based deep learning models trained on >50,000 manually annotated holotomograms; (ii) Time-resolved dry mass kinetics with statistical outlier detection; (iii) Export of quantified morphometrics (volume, sphericity, surface-to-volume ratio) to CSV or MATLAB-compatible structures; (iv) Cloud-synchronized project repositories with role-based access control (RBAC) and versioned metadata logging. All processing pipelines are scriptable via Python API and support integration with JupyterLab for reproducible computational analysis. Audit logs record user actions, parameter changes, and calibration events in UTC timestamped entries compliant with ISO/IEC 27001 information security frameworks.
Applications
- Label-free characterization of circulating tumor cells (CTCs) in microfluidic isolation chips
- Non-invasive sperm motility and morphology assessment for IVF quality control (validated per WHO 2021 guidelines)
- Real-time tracking of Plasmodium falciparum-infected erythrocytes across ring, trophozoite, and schizont stages
- Quantitative analysis of neutrophil chemotaxis and phagocytic cup formation without opsonization artifacts
- 3D morphometric profiling of patient-derived glioblastoma spheroids during drug response assays
- Digital hematology: differentiation of leukocyte subtypes based on refractive index heterogeneity and nuclear texture metrics
- Label-free immunohistochemistry surrogate: correlation of refractive index gradients with antigen density in FFPE tissue sections (research-use-only)
FAQ
How does holotomographic imaging differ from conventional brightfield or phase contrast microscopy?
Holotomography acquires >100 angularly diverse holograms to computationally reconstruct a 3D refractive index map—enabling absolute quantification of intracellular mass distribution, unlike qualitative intensity-based contrast methods.
Can the system image through standard culture inserts or transwell membranes?
Yes—provided the membrane thickness is ≤12 µm and optical clarity meets ISO 10110-2 transmission standards; recommended insertion depth ≤0.5 mm from coverslip surface.
Is STEVE software compatible with Linux-based HPC clusters for batch processing?
Yes—STEVE’s CLI mode supports Slurm and PBS job schedulers; all segmentation and quantification modules are containerized via Docker (tested on CentOS 7.9 and Ubuntu 22.04 LTS).
What regulatory documentation is provided for GxP environments?
Nanolive supplies IQ/OQ/PQ protocols, traceable calibration certificates (NIST-traceable reference beads), and a 21 CFR Part 11 compliance package including electronic signature workflows and immutable audit log exports.
Does the system require environmental vibration isolation?
No active isolation table is required; the optical design incorporates passive damping and real-time wavefront correction, achieving <5 nm RMS path-length stability on standard optical benches per ISO 10110-5.