PhenoPlot® Suspended Dual-Rail Plant Phenotyping Imaging System
| Origin | Beijing, China |
|---|---|
| Manufacturer Type | Authorized Distributor |
| Origin Category | Domestic (China) |
| Model | PhenoPlot® |
| Pricing | Available Upon Request |
Overview
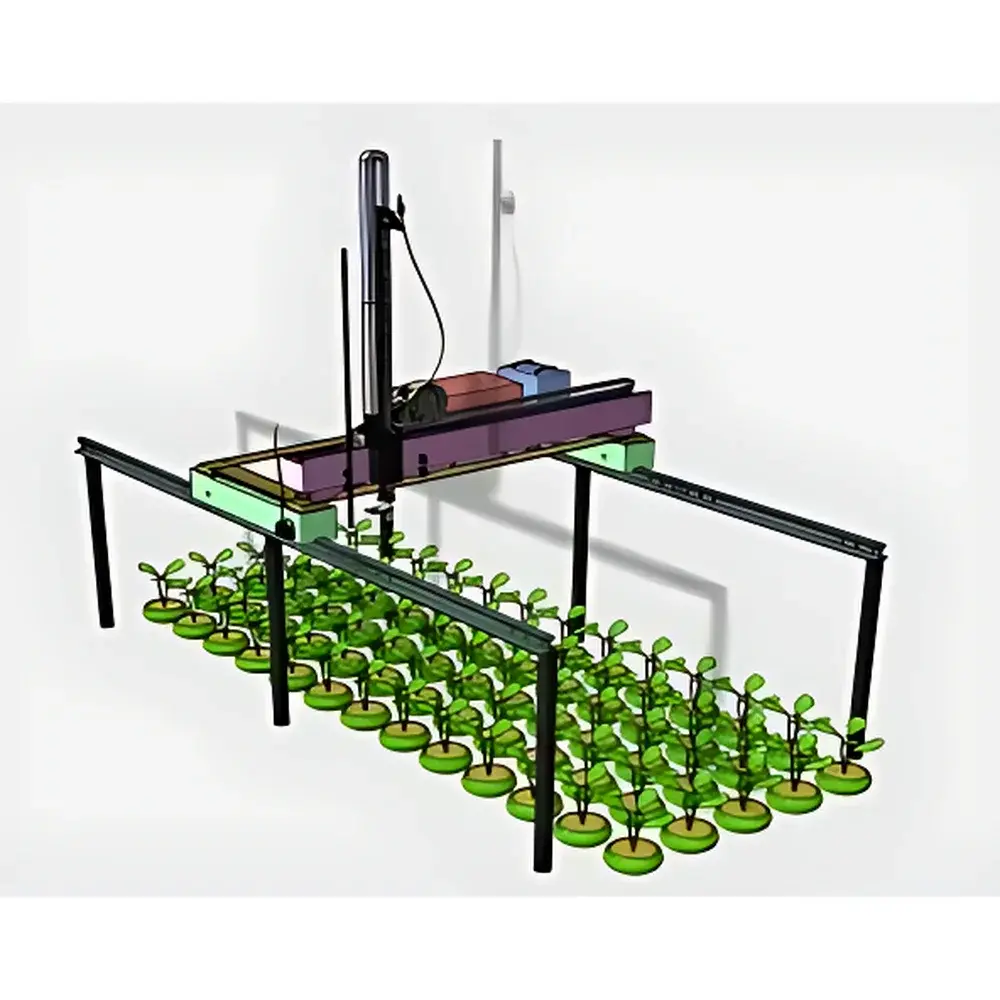
The PhenoPlot® Suspended Dual-Rail Plant Phenotyping Imaging System is a field-deployable, high-precision phenotyping platform engineered for non-destructive, in-situ, three-dimensional spectral imaging of plants across diverse experimental setups — including open-field plots, soil-monitored lysimeters (e.g., Soiltron iPOT systems), greenhouse containers, and controlled-environment mesocosms. Its core architecture implements Sensor-to-Plant (STP) methodology, eliminating plant relocation and minimizing measurement artifacts induced by handling or environmental disturbance. The system employs a suspended dual-rail Y-axis framework, over which an X-axis gantry traverses with sub-centimeter positional repeatability; Z-axis motorized lift enables precise vertical adjustment of sensor height. This XYZ triaxial motion control ensures full volumetric coverage of heterogeneous plant canopies without occlusion or blind zones. Unlike traditional gantry or overhead crane systems requiring embedded ground rails — which disrupt soil integrity, impede agricultural operations, and introduce contamination risks — the PhenoPlot®’s rail-free suspension design preserves plot-level ecological fidelity while reducing installation footprint and civil engineering overhead.
Key Features
- Suspended dual-rail mechanical architecture: eliminates ground-track excavation, minimizes land use impact, and supports rapid deployment on existing agricultural fields or research sites.
- Triaxial automated scanning (X/Y/Z): programmable travel range (standard: 5 m × 20 m × 2 m; customizable), speed 1–40 mm/s, positional accuracy <1 cm.
- Multi-spectral sensor suite: integrated 400–1000 nm hyperspectral imager (224 bands, FWHM 5.5 nm, 1024-pixel spatial resolution, SNR 600:1, 330 FPS); 900–1700 nm hyperspectral imager (224 bands, FWHM 8 nm, SNR 1000:1, 670 FPS); scientific-grade thermal imager (640 × 512 pixels, –25 to +150 °C, thermal sensitivity ≤0.03 °C, NUC-corrected).
- Chlorophyll fluorescence imaging module (FluorCam-based): XYZ-coordinated scanning, 35 × 45 mm FOV per frame, triple-wavelength LED excitation (620 nm pulse-modulated measuring light, 620 nm red + 5700 K white actinic light, 735 nm far-red), saturating pulse up to 3900 µmol·m⁻²·s⁻¹, 50+ quantitative fluorescence parameters (Fv/Fm, Y(II), NPQ, ETR, Rfd, qP, etc.) with real-time parameter mapping and temporal curve generation.
- Onboard environmental sensing: integrated GPS, temperature/humidity, PAR, and lux sensors; all timestamps synchronized and auto-calibrated via GPS-derived UTC time.
- Protocol-driven automation: supports up to 10 user-defined acquisition protocols (e.g., multi-sensor sequential capture, time-series NDVI + thermal + fluorescence), enabling unattended overnight or multi-day monitoring campaigns.
- Embedded 10-inch touchscreen HMI with Linux-based OS; wireless remote operation via CAN bus and 5G-compatible IoT gateway using star-topology sensor network architecture.
Sample Compatibility & Compliance
The PhenoPlot® accommodates heterogeneous plant architectures — from low-canopy cereals and legumes to tall-stemmed maize, sorghum, or perennial shrubs — under both field and semi-controlled conditions. It supports standard agronomic plot sizes (e.g., 1 × 1 m to 5 × 20 m), Soiltron iPOT lysimeters, and modular containerized growth systems. All optical and thermal measurements adhere to ISO 17123-7 (field instruments for vegetation reflectance), ASTM E2915 (thermal imaging for plant stress detection), and FAO-recommended protocols for canopy-level physiological index derivation. Data provenance is maintained through embedded timestamping, GPS georeferencing, and metadata tagging compliant with MIAPPE v1.1 (Minimum Information About a Plant Phenotyping Experiment). The system’s embedded database architecture supports audit-ready logging required for GLP-compliant phenotyping trials and USDA/NIFA-funded field studies.
Software & Data Management
The PhenoPlot® operates via a bilingual (English/Chinese) ground station software suite running on Windows or Linux platforms, featuring intuitive drag-and-drop protocol builder, real-time sensor fusion dashboard, and batch-processing pipelines for radiometric calibration, geometric correction, and spectral index computation. Acquired hyperspectral cubes are stored in ENVI-compatible BIL format; thermal and fluorescence datasets include embedded calibration coefficients and exposure metadata. A dedicated phenotyping data server (optional) provides RESTful API access, supports DICOM-like hierarchical storage, and integrates natively with common agri-data platforms (e.g., BreedBase, Gramene, Crop Ontology) via OGC SensorThings API v1.1. All raw and processed data retain traceability for FDA 21 CFR Part 11–compliant environments when configured with digital signature and audit-trail modules.
Applications
- In-situ field phenotyping: longitudinal monitoring of canopy structure, biomass accumulation, nitrogen status (NDNI, NDLI), water use efficiency (MSI, NDWI), and photosynthetic performance across breeding nurseries or climate-resilience trials.
- Stress physiology research: quantification of drought-induced stomatal closure (via thermal canopy temperature differentials), photooxidative damage (PRI, NPQI), pigment degradation (ARI, CRI), and senescence progression (MCARI/TCARI ratio dynamics).
- High-throughput germplasm screening: automated classification of genetic lines based on multivariate spectral signatures linked to yield proxies, disease resistance markers (e.g., early fungal infection via altered NIR reflectance), or abiotic tolerance traits.
- Soil–plant interaction studies: co-registered spectral–thermal–fluorescence analysis of root-zone moisture gradients, evapotranspiration partitioning, and rhizosphere-mediated stress signaling.
- Ecosystem-scale biodiversity assessment: plot-level spectral diversity metrics (e.g., spectral entropy, Bray–Curtis dissimilarity) derived from hyperspectral mosaics for habitat mapping and functional trait estimation.
FAQ
What mounting infrastructure is required for field deployment?
No ground excavation or permanent foundation is needed. The suspended dual-rail system mounts to freestanding steel posts anchored at plot boundaries — compatible with standard agricultural field layouts.
Can the system operate autonomously during nighttime or adverse weather?
Yes. The platform supports scheduled protocols with onboard power management; however, optical sensors require ambient illumination or optional full-spectrum LED lighting (sold separately) for nocturnal operation. Thermal and fluorescence modules remain fully functional under low-light conditions.
How is spectral data calibrated for inter-seasonal comparability?
Each acquisition includes reference panel capture (Spectralon® or custom ceramic tile) and dark-current correction. Radiometric calibration coefficients are stored per sensor and applied automatically during post-processing.
Is third-party sensor integration supported?
Yes. The star-topology IoT interface supports Modbus RTU/TCP and MQTT protocols, enabling plug-and-play integration of external sensors (e.g., sap flow meters, stem dendrometers, soil moisture probes) into the unified data stream.
What level of technical support and software updates are provided?
Users receive lifetime access to firmware and software updates, plus remote diagnostics and annual calibration verification services — delivered through authorized regional service centers aligned with ISO/IEC 17025-accredited calibration laboratories.