PlantScreen Conveyor-Belt Plant Phenotyping Imaging Platform
| Brand | PSI (Czech Republic) |
|---|---|
| Origin | Czech Republic |
| Model | PlantScreen Conveyor-Belt |
| Imaging Area | 35 × 35 cm |
| Conveyor Length | 400 cm |
| Positioning Accuracy | ±0.1 mm |
| Scan Speed | up to 150 mm/s |
| Fluorescence Imaging | Modulated Red LED (620 nm), Far-Red LED (735 nm), Dual-Color Actinic Light (Red + Blue / Red + Cool White) |
| CCD Options | 720 × 560 @ 50 fps (GFP-compatible) or 1360 × 1024 @ 20 fps |
| Fluorescence Parameters | Fo, Fo′, Fs, Fm, Fm′, Fv, NPQ, QY, Rfd, and >50 derived metrics |
| RGB Sensor | 2560 × 1920, 1/2.5″ CMOS, 2.2 µm pixel size |
| Thermal Imaging (optional) | 640 × 480, NETD < 0.05 °C @ 30 °C, 20–120 °C range |
| Software | PSI PhenotypeDB™ with automated protocol scheduling, GLP-compliant audit trail, remote web access, role-based user permissions, and real-time data visualization |
Overview
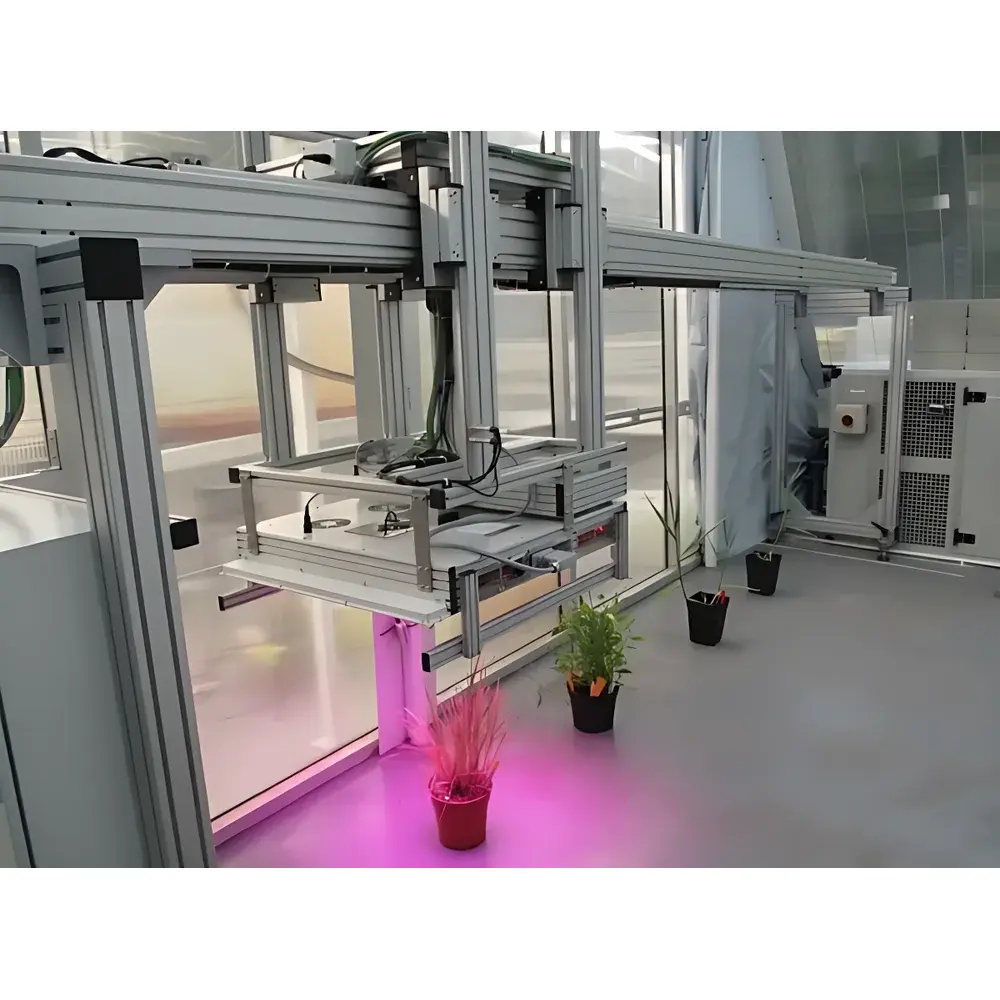
The PlantScreen Conveyor-Belt Plant Phenotyping Imaging Platform is a fully integrated, non-invasive, high-throughput phenotyping system engineered for controlled-environment research in greenhouses and large-scale growth chambers. Designed and manufactured by Photon Systems Instruments (PSI) in the Czech Republic, the platform employs synchronized multi-modal imaging—chlorophyll fluorescence, RGB color, and optional infrared thermography—to quantify dynamic physiological responses across plant populations under controlled or gradient stress conditions. Its core measurement principle relies on pulse-amplitude modulated (PAM) fluorometry, calibrated actinic illumination, and high-sensitivity CCD/CMOS detection to extract quantitative photosynthetic parameters—including quantum yield (ΦPSII), non-photochemical quenching (NPQ), and photochemical quenching (qP)—with high temporal and spatial reproducibility. The conveyor-belt architecture enables precise, programmable positioning of individual pots (up to 12 × 30 cm diameter per scan cycle) along a 400 cm sample track, supporting longitudinal studies of growth dynamics, stress acclimation, and recovery kinetics without manual intervention.
Key Features
- World’s largest single-frame chlorophyll fluorescence imaging area (35 × 35 cm), enabling full-plant canopy analysis without tiling or stitching artifacts.
- Modular optical configuration: Standard PAM fluorescence module with 620 nm measuring light, 735 nm far-red saturating pulse, and dual-color actinic sources (red + blue or red + cool white) for accurate Fo′ and Fm′ determination.
- Dual CCD options: High-speed sensor (720 × 560, 50 fps) optimized for GFP and transient fluorescence kinetics; or high-resolution sensor (1360 × 1024, 20 fps) for detailed morphometric and fluorescence heterogeneity mapping.
- Integrated RGB imaging subsystem with auto-exposure, white balance, and sub-pixel image registration—delivering 2560 × 1920 resolution, 2.2 µm pixel pitch, and robust segmentation for leaf area, compactness, eccentricity, convex hull area, centroid tracking, and relative growth rate (RGR) calculation.
- Optional calibrated thermal imaging unit (640 × 480, NETD < 0.05 °C) for stomatal conductance inference, drought response profiling, and pathogen-induced thermal anomalies.
- Seven-position filter wheel with excitation/emission bandpass filters for GFP, YFP, RFP, and other fluorescent protein variants—supporting transgenic expression validation and promoter activity quantification.
- Mechanically robust, wheeled gantry structure with vertical height adjustment (60–110 cm standard; customizable), facilitating non-destructive, in situ imaging of plants ranging from Arabidopsis rosettes to mature maize or tomato canopies.
- Real-time data acquisition and on-board processing via PSI PhenotypeDB™ software, including automated ROI definition, parameter time-series export, and interactive histogram and scatter-plot visualization.
Sample Compatibility & Compliance
The PlantScreen Conveyor-Belt platform accommodates standard cultivation vessels—including 30 cm-diameter pots, SoilTron mini-lysimeters, and custom trays—without modification. Its open mechanical architecture supports integration with third-party environmental control systems (e.g., climate chambers, irrigation modules) and optional FS-WI walk-in growth rooms featuring programmable PAR (up to 1000 µmol·m⁻²·s⁻¹), temperature (10–40 °C), and humidity (40–80 % RH ±7 %) profiles. All hardware and software components comply with CE marking requirements. Data management functions meet GLP and GxP documentation standards, including electronic signatures, audit trails compliant with FDA 21 CFR Part 11, and immutable timestamped metadata logging for each imaging event. Export formats include HDF5, TIFF, CSV, and MIAME-compliant XML for interoperability with FAIR-aligned phenomics repositories.
Software & Data Management
PhenotypeDB™ serves as the unified control, acquisition, and analytics environment. It features a web-accessible interface enabling remote experiment scheduling, live dashboard monitoring, and post-acquisition batch processing. Users define measurement protocols using a drag-and-drop workflow editor—specifying illumination sequences, exposure durations, sensor triggers, and positional coordinates—then deploy them to the PLC-controlled conveyor system. All raw images and derived parameters are stored in a relational database with hierarchical sample metadata (genotype, treatment, timepoint, operator). Advanced tools include semi-automated image segmentation, multi-parameter correlation heatmaps, growth curve fitting (Gompertz, logistic), and statistical comparison across experimental groups (ANOVA, PCA, hierarchical clustering). Software updates are delivered automatically and free of charge for the product lifetime.
Applications
- Quantitative assessment of abiotic stress tolerance (drought, salinity, heat, cold) via kinetic NPQ, ΦPSII, and thermal heterogeneity indices.
- High-throughput screening of crop germplasm for photosynthetic efficiency, carbon assimilation capacity, and recovery resilience.
- Functional genomics studies linking allelic variation to dynamic physiological outputs under controlled environmental gradients.
- Transgenic line validation through spatially resolved GFP/YFP expression kinetics coupled with concurrent chlorophyll fluorescence status.
- Ecotoxicological assays measuring photosystem II inhibition and membrane integrity loss in response to heavy metals or agrochemicals.
- Longitudinal phenotyping across developmental stages—from seedling emergence to reproductive maturity—with daily or circadian-interval imaging schedules.
- Validation of remote sensing algorithms using ground-truthed spectral and thermal signatures at canopy scale.
FAQ
What is the maximum throughput capacity per hour?
A full scan cycle for 12 pots (30 cm diameter) takes ≤60 seconds; with minimal inter-scan delay, the system achieves ≥60 complete scans per hour under standard protocols.
Can the system operate unattended overnight or over weekends?
Yes—PhenotypeDB™ supports scheduled autonomous operation with power-fail recovery, hardware watchdog timers, and email/SMS alerts for abnormal events.
Is calibration traceable to international standards?
Fluorescence and thermal modules are factory-calibrated against NIST-traceable reference standards; annual recalibration services are available through PSI-certified labs.
Does the platform support integration with LIMS or ELN systems?
Yes—via RESTful API and configurable CSV/JSON export pipelines, enabling bidirectional synchronization with laboratory information management systems.
What electrical requirements does the system have?
Standard operation requires 230 V AC, 50 Hz, 16 A; an optional DC power supply kit (24 V input) is available for off-grid or mobile deployment scenarios.
Related Products


