Radiant Zemax NFMS0400 Two-Axis Luminance and Chromaticity Distribution Measurement System
| Brand | Radiant Zemax |
|---|---|
| Origin | USA |
| Model | NFMS0400 / FPMS0400 |
| Type | Near-Field Measurement System for Luminaires |
| Compliance | Supports IESNA LM-79, CIE S 025, ISO/CIE 19476 |
| Software Platform | TrueTest™ v7.0+ |
| Detector Options | ProMetric® Y-series (luminance) and I-series (chromaticity) imaging photometers |
| Angular Range | ±90° in azimuth, ±90° in elevation |
| Spatial Resolution | Up to 9M pixels per image |
| Dynamic Range | ≥1,000,000:1 (typical with HDR acquisition) |
| Calibration Traceability | NIST-traceable luminance & chromaticity standards |
Overview
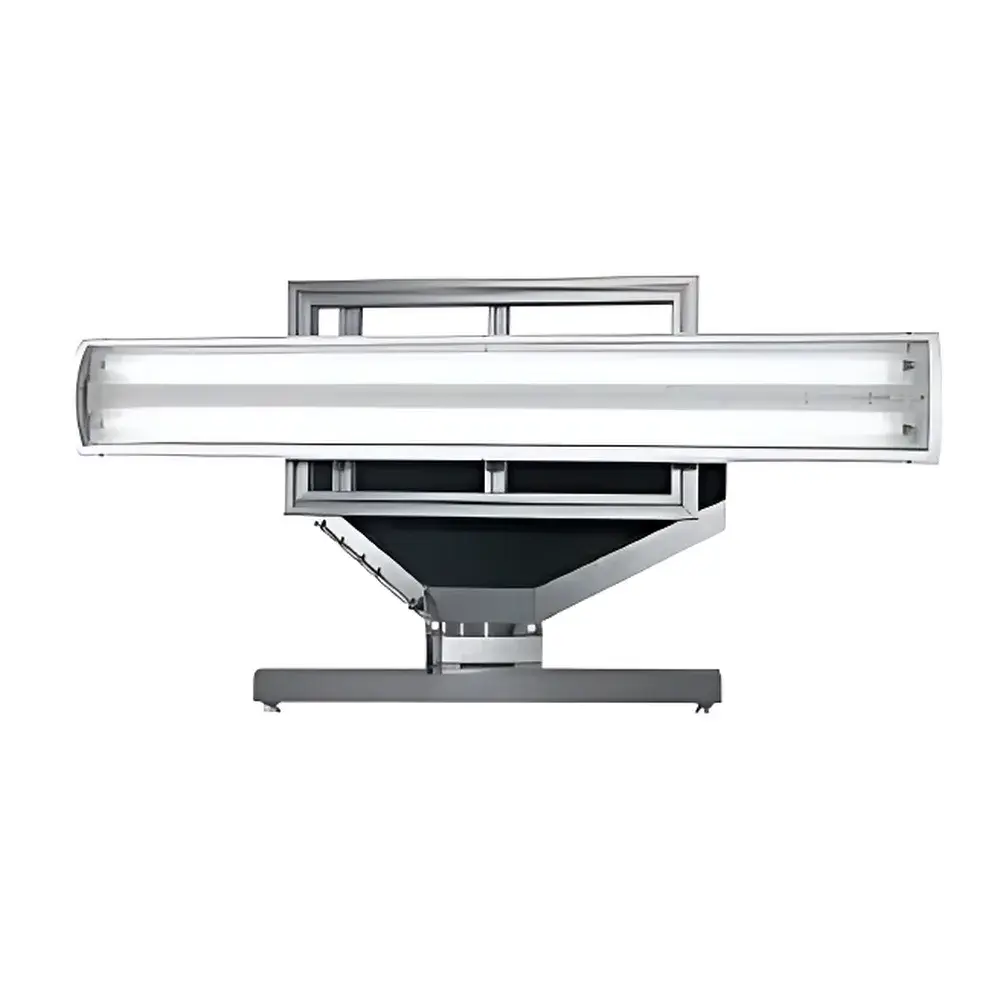
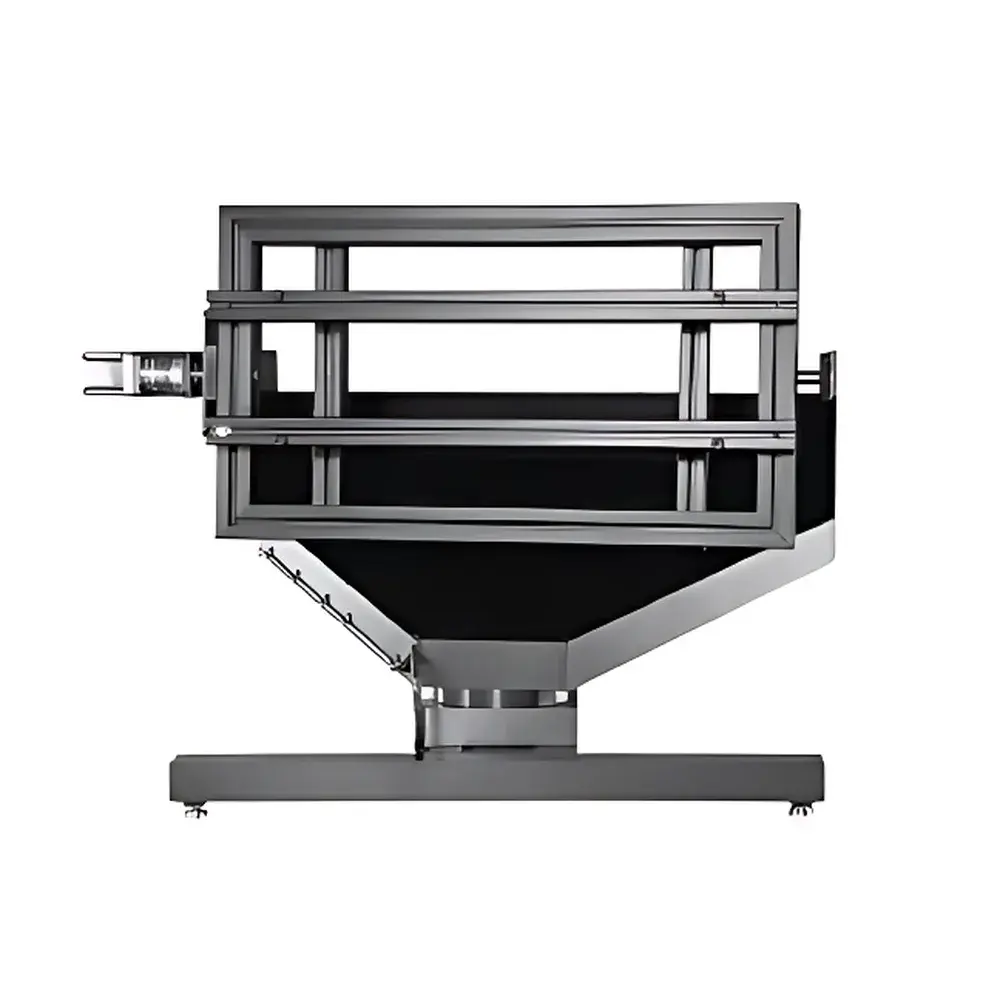
The Radiant Zemax NFMS0400 Two-Axis Luminance and Chromaticity Distribution Measurement System is an automated near-field goniophotometric platform engineered for high-fidelity spatial characterization of light sources—particularly LED luminaires, backlit displays, and automotive lighting modules. Unlike conventional far-field goniometers that require large optical rooms and extended measurement times, the NFMS0400 employs a calibrated imaging photometer mounted on a precision dual-axis (azimuth/elevation) rotation stage to capture high-dynamic-range (HDR) luminance and chromaticity images across a full hemisphere (±90° × ±90°). These spatially resolved radiometric datasets are mathematically transformed—via convolution-based near-to-far-field conversion algorithms—into industry-standard photometric files including IESNA LM-63 (.ies), EULUMDAT (.ldt), and CIE 127-compliant intensity distributions. The system operates on the fundamental principle of solid-angle-resolved imaging photometry, where each pixel corresponds to a discrete solid angle element (dΩ), enabling pixel-level computation of luminous intensity (cd), luminance (cd/m²), chromaticity coordinates (CIE 1931 x,y or u’v’), and correlated color temperature (CCT) as functions of viewing angle.
Key Features
- Automated dual-axis goniometric positioning with <0.05° angular repeatability and programmable step resolution down to 0.1°
- Modular imaging photometer integration: ProMetric® Y43 (4.3 MP monochrome) or I29 (2.9 MP trichromatic) sensors, all NIST-traceably calibrated for luminance (0.001–200,000 cd/m²) and chromaticity (Δu’v’ < 0.002)
- TrueTest™ software v7.0+ with embedded near-field-to-far-field transformation engine compliant with IES TM-21 and CIE 127:2007 methodologies
- Support for multi-exposure HDR acquisition to preserve detail across extreme luminance gradients (e.g., LED chip hotspots vs. diffuser regions)
- Thermally stabilized optical bench with vibration-damped granite base and environmental monitoring (temperature/humidity logging)
- Configurable test fixtures accommodating luminaires up to 400 mm diameter (NFMS0400) or flat-panel displays up to 300 × 300 mm (FPMS0400 variant)
Sample Compatibility & Compliance
The NFMS0400 accommodates a broad spectrum of light-emitting devices—including omnidirectional A-lamps, directional reflector lamps (PAR, MR), linear troffers, OLED panels, and automotive headlamp assemblies—without requiring optical reconfiguration. Sample mounting interfaces support both mechanical clamping and vacuum-based fixturing for planar or curved surfaces. All measurements adhere to international photometric standards: IESNA LM-79-19 (Electrical and Photometric Measurements of SSL Products), CIE S 025/E:2015 (Test Methods for LED Lamps, LED Luminaires and LED Modules), and ISO/CIE 19476:2014 (Characterization of Light Sources by Imaging Goniophotometry). Data outputs include audit-ready reports with full metadata (calibration date, sensor ID, ambient conditions, operator ID) required for GLP-compliant lighting R&D labs and regulatory submissions.
Software & Data Management
TrueTest™ software provides a unified environment for instrument control, real-time visualization, data reduction, and standards-compliant reporting. It features role-based user access control, electronic signature capability, and full 21 CFR Part 11 compliance—including immutable audit trails for all measurement parameters, calibration events, and report exports. Raw image stacks (TIFF/EXR), processed angular data (CSV, XML), and photometric files (.ies, .ldt) are stored in a structured database with version-controlled archiving. Advanced analysis modules enable iso-luminance contour mapping, chromaticity uniformity evaluation (Δu’v’ across viewing cone), CCT shift profiling, and glare index computation (UGR, EGI) directly from spatial datasets.
Applications
- Photometric validation of LED luminaire designs prior to IES file submission for energy certification (ENERGY STAR, DLC)
- Color consistency verification across viewing angles for microLED and Mini-LED display panels
- Optical safety assessment (IEC 62471) via spectral radiance and blue-light hazard weighting
- Development of bidirectional scattering distribution functions (BSDF) for diffusers and light guides
- Comparative analysis of optical lens/housing geometries on beam shaping performance
- Supporting DOE Lighting Facts labeling requirements with traceable, repeatable angular photometry
FAQ
What distinguishes NFMS from FPMS?
NFMS (Near-Field Measurement System) is optimized for volumetric light sources (e.g., bulbs, troffers) where near-field irradiance patterns must be captured and converted to far-field intensity; FPMS (Flat-Panel Measurement System) targets thin, self-emissive displays with minimal depth, using fixed-focus geometry and optimized flat-field correction.
Can the system measure pulsed or modulated light sources?
Yes—TrueTest™ supports synchronized external triggering and adjustable integration gating to accurately capture luminance/chromaticity during specific phases of PWM or DALI dimming cycles.
Is NIST-traceable recalibration required annually?
Radiant recommends annual recalibration against NIST-traceable standards; certificate includes luminance linearity, chromaticity accuracy, and geometric distortion verification per CIE Publication 127:2007 Annex B.
Does the system support third-party spectral data integration?
Yes—spectral power distribution (SPD) files (e.g., from CAS spectroradiometers) can be imported to augment chromaticity calculations and enable spectral radiant intensity derivation.
What is the typical measurement time for a full hemispherical scan?
At 1° angular resolution with 3-exposure HDR, a full ±90° × ±90° scan requires approximately 18–22 minutes, depending on detector model and dynamic range settings.