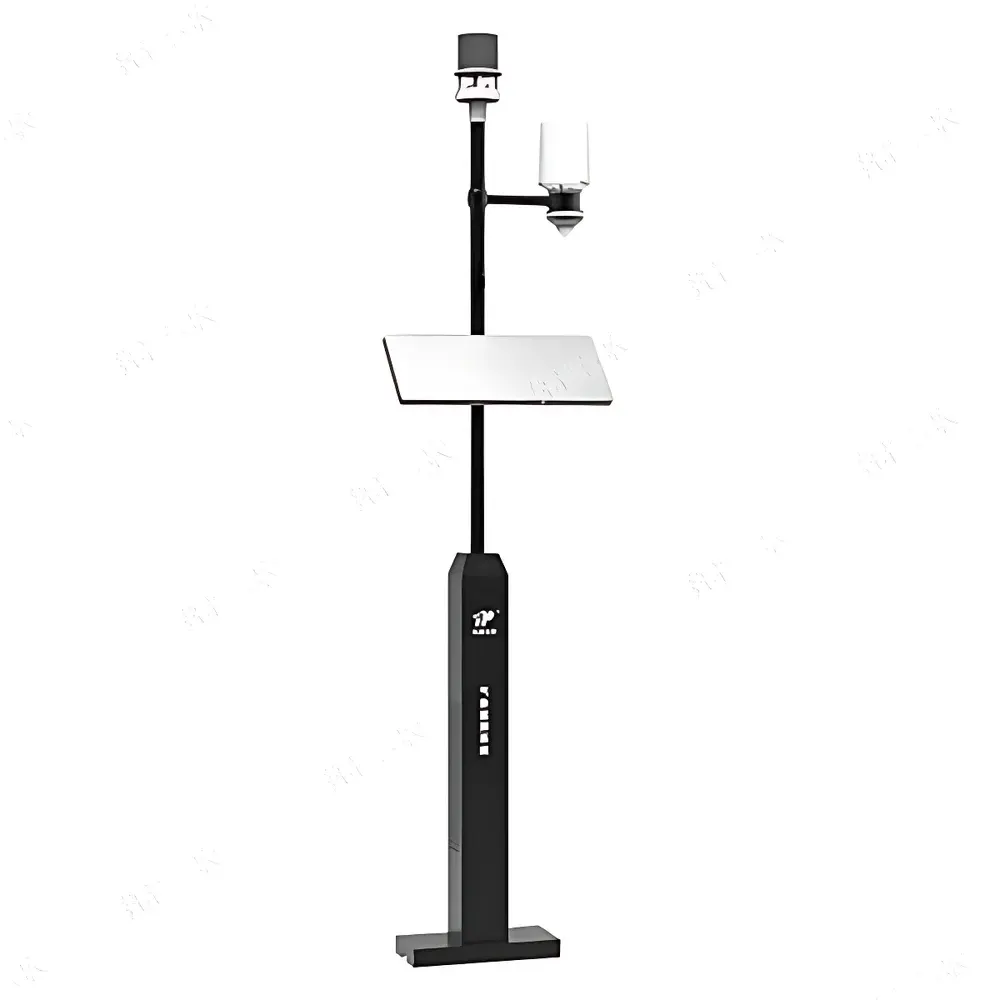
TopCloud-agri TP-WMS-PHY Series Field-based High-throughput Crop Phenotyping Monitoring System
| Brand | TopCloud-agri |
|---|---|
| Origin | Zhejiang, China |
| Manufacturer | Yes |
| Country of Origin | China |
| Model | TP-WMS-PHY / TP-WMS-PHY-2 / TP-WMS-PHY-3 |
| Imaging Modalities | Visible-light (TP-WMS-PHY), Multispectral + RGB (TP-WMS-PHY-2), Multispectral + RGB + Thermal Infrared (TP-WMS-PHY-3) |
| Multispectral Sensor | 6-band (450 nm, 560 nm, 660 nm, 720 nm, 750 nm, 850 nm), 400 MP resolution, 32× optical zoom |
| Thermal Camera | Non-contact infrared, 640 × 512 resolution, temperature range −20 °C to 150 °C (standard mode) or 0 °C to 550 °C (extended mode), accuracy ±2 °C or ±2% of reading (whichever is greater) |
| Power Supply | Solar-powered |
| Height | 2.2 m |
| Integrated GNSS | Yes, with altitude and georeferenced coordinate logging |
Overview
The TopCloud-agri TP-WMS-PHY Series Field-based High-throughput Crop Phenotyping Monitoring System is a fixed-site, autonomous phenotyping platform engineered for long-term, non-invasive monitoring of crop growth dynamics under natural field conditions. Built on a modular architecture, it integrates synchronized visible-light, multispectral, and thermal infrared imaging—each calibrated in real time against ambient illumination—to quantify morphological, physiological, and biophysical traits across spatial and temporal scales. Unlike greenhouse-based or mobile platforms, this system operates continuously without manual intervention, capturing high-resolution time-series data aligned to precise geographic coordinates (latitude, longitude, elevation). Its core measurement principles include reflectance-based vegetation index derivation (e.g., NDVI, GNDVI, NDRE), radiometric thermal mapping for stomatal conductance inference, and computer vision–driven canopy segmentation for structural trait extraction (e.g., canopy cover, height progression, phenological stage classification). Designed for integration into breeding nurseries, agronomic trials, and ecological monitoring networks, the system supports hypothesis-driven research requiring reproducible, traceable, and audit-ready field phenomics datasets.
Key Features
- Autonomous All-Weather Operation: Solar-powered hardware with IP65-rated enclosure ensures uninterrupted data acquisition across seasonal extremes—including rain, dust, and temperature fluctuations—without on-site maintenance.
- Modular Imaging Configuration: Three standardized variants (TP-WMS-PHY, TP-WMS-PHY-2, TP-WMS-PHY-3) allow users to select sensor payloads based on experimental scope: visible-only for structural phenotyping; multispectral + RGB for spectral vegetation indices; or full multispectral + thermal for combined water status and vigor assessment.
- Real-Time Environmental Calibration: Onboard ambient light sensors dynamically adjust exposure and gain parameters prior to each image capture, minimizing irradiance-induced variability and ensuring inter-day spectral consistency.
- Georeferenced Data Provenance: Integrated GNSS module logs WGS84 coordinates and elevation for every image and derived metric, enabling spatial alignment with GIS layers, plot-level metadata association, and anti-theft displacement alerts.
- Phenological Stage Classification: Pre-trained convolutional neural networks (CNNs) process time-series imagery to detect key developmental transitions (e.g., emergence, tillering, heading, senescence) using morphology-spectral-temporal signatures—outputting stage labels with confidence scores and uncertainty intervals.
Sample Compatibility & Compliance
The TP-WMS-PHY Series is validated for use with major cereal, legume, oilseed, and vegetable crops—including wheat, rice, maize, soybean, canola, and tomato—across diverse soil types and irrigation regimes. Its non-destructive, remote sensing approach complies with OECD Test Guidelines for Plant Biotechnology and aligns with FAO’s Framework for Crop Phenotyping Data Standards. While not certified to ISO/IEC 17025 for metrological calibration, the system’s raw sensor outputs (DN values, radiance maps, thermal matrices) are traceable to NIST-traceable reference panels and blackbody sources used during factory calibration. All derived vegetation indices conform to peer-reviewed definitions published in Remote Sensing of Environment and IEEE Transactions on Geoscience and Remote Sensing. Data storage architecture meets GLP-compliant requirements for audit trails, including immutable timestamps, user-action logs, and versioned processing pipelines.
Software & Data Management
Data ingestion, processing, and visualization occur via the TopCloud-agri Phenotype Cloud Platform—a secure, role-based SaaS environment accessible through web browsers and native iOS/Android applications. Raw images and sensor metadata are ingested automatically and stored in encrypted object storage with versioned backups. The platform implements automated batch processing workflows: orthorectification using GNSS + IMU data; radiometric correction via dark-frame subtraction and flat-field normalization; pixel-wise vegetation index computation; thermal emissivity compensation using surface emissivity assumptions (0.96–0.99); and canopy segmentation using U-Net–based semantic segmentation models trained on multi-species field imagery. Export options include CSV (trait time series), GeoTIFF (spatial rasters), and HDF5 (multi-dimensional arrays), all annotated with MIAPPE-compliant metadata. For regulated environments, optional 21 CFR Part 11 compliance modules provide electronic signature enforcement, audit log retention (>10 years), and user permission hierarchies.
Applications
- Crop Breeding Programs: Accelerated selection of drought-tolerant, heat-resilient, or disease-resistant genotypes via longitudinal tracking of canopy temperature depression (CTD), NDVI slope, and green area duration (GAD).
- Pesticide & Agrochemical Screening: Quantitative comparison of phytotoxicity, efficacy onset, and recovery kinetics by monitoring chlorophyll-related indices (e.g., LCI, NDRE) and thermal heterogeneity pre- and post-application.
- Climate-Smart Agriculture Research: Correlation of phenotypic plasticity metrics (e.g., thermal time to flowering, canopy closure rate) with microclimate variables (soil moisture, vapor pressure deficit) derived from co-located weather stations.
- National Phenotyping Infrastructure: Scalable deployment across regional trial networks to generate harmonized, cross-site phenomic datasets supporting genome-wide association studies (GWAS) and genomic prediction model training.
FAQ
What is the recommended minimum plot size for reliable trait extraction?
For robust canopy-level metrics (e.g., NDVI, canopy temperature), plots should be ≥2 m × 2 m to ensure full sensor field-of-view coverage and minimize edge effects.
Can the system operate without cellular connectivity?
Yes—onboard SD card storage retains raw data locally for up to 90 days; synchronization to the cloud occurs automatically upon reconnection.
Are vegetation index algorithms customizable?
Users may define custom band combinations and formulas via the platform’s scripting interface (Python-based), subject to validation against reference spectroradiometer measurements.
How often is firmware updated, and how are updates deployed?
Firmware releases follow quarterly security and calibration patches; updates are delivered over-the-air (OTA) with rollback capability and pre-deployment validation reports.
Is third-party software integration supported?
RESTful APIs enable bidirectional data exchange with R, Python (via phenopype, plantcv), BreedBase, and FieldBook, supporting FAIR data principles and pipeline interoperability.
Related Products


