CI-110 Canopy Analyzer by CID Bio-Science
| Brand | CID Bio-Science |
|---|---|
| Origin | USA |
| Model | CI-110 |
| Lens FOV | 150° |
| Camera Resolution | 8 MP |
| Display | 7" touchscreen with 6 physical buttons |
| Measurement Time | 0.5 s |
| PAR Sensors | 24-channel integrated quantum sensors |
| Operating Environment | 5–50 °C, 0–100% RH (non-condensing) |
| Telescoping Handle Length | 400 mm |
| GPS Integration | Yes, with real-time coordinate logging |
| Canopy Partitioning | Zenith angle (1–10 zones), Azimuth angle (1–10 sectors) |
| Image Analysis Modes | Manual threshold adjustment, Otsu auto-thresholding, sky/leaf color filtering, user-defined masking |
| Power Supply | Rechargeable battery (>6 h continuous operation) |
Overview
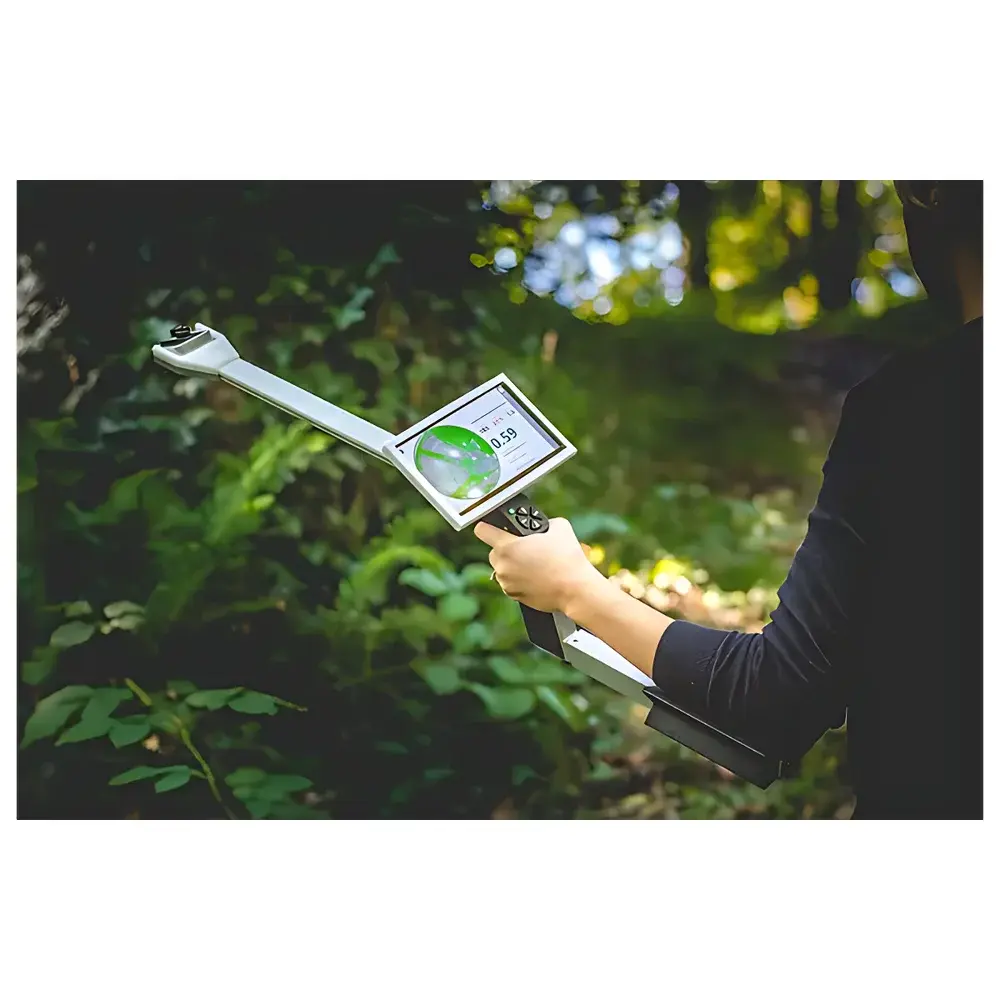
The CI-110 Canopy Analyzer is a field-deployable, image-based instrument engineered for rapid, non-destructive quantification of plant canopy structure and light interception dynamics. It operates on the principle of hemispherical photography—capturing upward-facing fisheye images of the canopy-sky interface using a calibrated 150° ultra-wide-angle lens and an 8-megapixel CCD sensor. Unlike traditional radiometric methods requiring multiple temporal measurements under varying solar conditions, the CI-110 acquires a single, geometrically corrected hemispherical image in under 0.5 seconds. Its integrated 24-channel PAR (Photosynthetically Active Radiation) sensor array simultaneously records incident and transmitted photon flux density across the measurement plane, enabling concurrent calculation of sunfleck frequency, direct beam transmission coefficients, and diffuse transmittance. The system’s built-in digital leveling mechanism ensures consistent nadir alignment regardless of terrain slope—eliminating the need for external leveling tools or sky-reference measurements. Designed for ecological robustness and operational repeatability, the CI-110 meets the technical requirements for longitudinal canopy monitoring under GLP-aligned field protocols.
Key Features
- Automated digital horizon leveling: Ensures precise zenith-aligned image capture without manual calibration or tripod dependency.
- Integrated 24-channel PAR sensor ring: Measures spectral irradiance (400–700 nm) at the sensor plane with NIST-traceable quantum response, supporting simultaneous LAI and radiation budget calculations.
- 7-inch sunlight-readable touchscreen interface: Enables real-time image preview, on-device threshold tuning, and immediate parameter visualization during field acquisition.
- Configurable angular partitioning: Supports customizable zenith (1–10 zones) and azimuth (1–10 sectors) binning for spatially resolved gap fraction analysis and leaf angle distribution modeling.
- Advanced image processing engine: Implements Otsu’s method for adaptive thresholding, RGB-based sky/leaf segmentation, and user-definable masking to exclude artifacts (e.g., operator shadow, branch occlusion, or cloud distortion).
- Embedded GPS + digital compass: Logs georeferenced metadata (WGS84 coordinates, heading, timestamp) for repeat-measurement site fidelity across growing seasons.
Sample Compatibility & Compliance
The CI-110 is validated for use across diverse vegetation strata—from herbaceous crops and orchard understories to mature forest canopies up to 30 m in height. Its adjustable focus lens accommodates measurement distances ranging from 0.3 m (for low-stature plants) to >5 m (for tall trees), maintaining optical resolution and vignetting control throughout. The instrument complies with ISO 11727:2019 (optical measurement of plant canopy structure) and supports data traceability in accordance with FDA 21 CFR Part 11 when used with audit-trail-enabled software configurations. All PAR sensor outputs are calibrated per ASTM E2797–21 (Standard Practice for Calibration of Quantum Sensors), and image metadata adhere to EXIF 2.32 standards for scientific reproducibility.
Software & Data Management
The proprietary CI-110 Analysis Software (v5.2+) runs on Windows platforms and provides full post-acquisition workflow control—including batch processing, spectral band masking, LAI sensitivity analysis, and extinction coefficient derivation via Beer-Lambert modeling. Raw images (.TIFF) and sensor logs (.CSV) are stored with embedded GPS tags and time stamps. The software supports export to common GIS formats (GeoJSON, Shapefile) and statistical packages (R, Python pandas). Audit trails record all user-initiated parameter edits, threshold adjustments, and masking operations—meeting GLP documentation requirements for regulatory submissions. Optional cloud synchronization enables centralized dataset aggregation across multi-site research networks.
Applications
- Agricultural phenotyping: Quantifying LAI dynamics in cereal, legume, and horticultural systems to correlate canopy development with yield potential and water-use efficiency.
- Forest ecology: Assessing vertical leaf area distribution, light penetration gradients, and seasonal gap fraction changes in temperate and boreal stands.
- Climate change research: Monitoring canopy structural responses to elevated CO₂, drought stress, or warming treatments across long-term FACE and warming chamber experiments.
- Remote sensing validation: Providing ground-truth LAI and gap fraction data for calibrating satellite-derived vegetation indices (e.g., MODIS LAI, Sentinel-2 FAPAR).
- Agroforestry system design: Optimizing tree spacing and understory crop selection based on modeled PAR transmission profiles and sunfleck duration statistics.
FAQ
Does the CI-110 require clear-sky conditions for accurate LAI estimation?
No. Its fisheye imaging geometry and automated horizon leveling enable reliable gap fraction analysis under overcast, partly cloudy, or even twilight conditions—no sky-reference measurement is needed.
Can the CI-110 be used beneath dense canopies where GPS signal is weak?
Yes. While GPS assists in georeferencing, the instrument stores location metadata only when a valid lock is achieved; all core canopy metrics (LAI, MLA, transmission coefficients) are computed independently of positional data.
Is the PAR sensor array calibrated against a reference spectroradiometer?
Yes. Each unit ships with individual calibration certificates traceable to NIST SRM 1930, with annual recalibration recommended per ISO/IEC 17025 guidelines.
How does the CI-110 handle mixed-species canopies with varying leaf reflectance properties?
The software includes customizable RGB and HSV color-space filters, allowing users to isolate target species based on spectral signature—particularly useful in weed-infested fields or multi-layered agroforestry plots.
What file formats are supported for data export and third-party integration?
Images export as lossless TIFF with embedded EXIF metadata; sensor logs as UTF-8 CSV; analysis results as XLSX with formula-locked worksheets; GIS-ready outputs include GeoJSON and ESRI Shapefile.
Related Products