EcoTech Digital Plant Factory Experimental Monitoring System
| Brand | EcoTech |
|---|---|
| Origin | Beijing, China |
| Manufacturer Type | Authorized Distributor |
| Country of Origin | China |
| Model | Digital Plant Factory |
| Pricing | Available Upon Request |
Overview
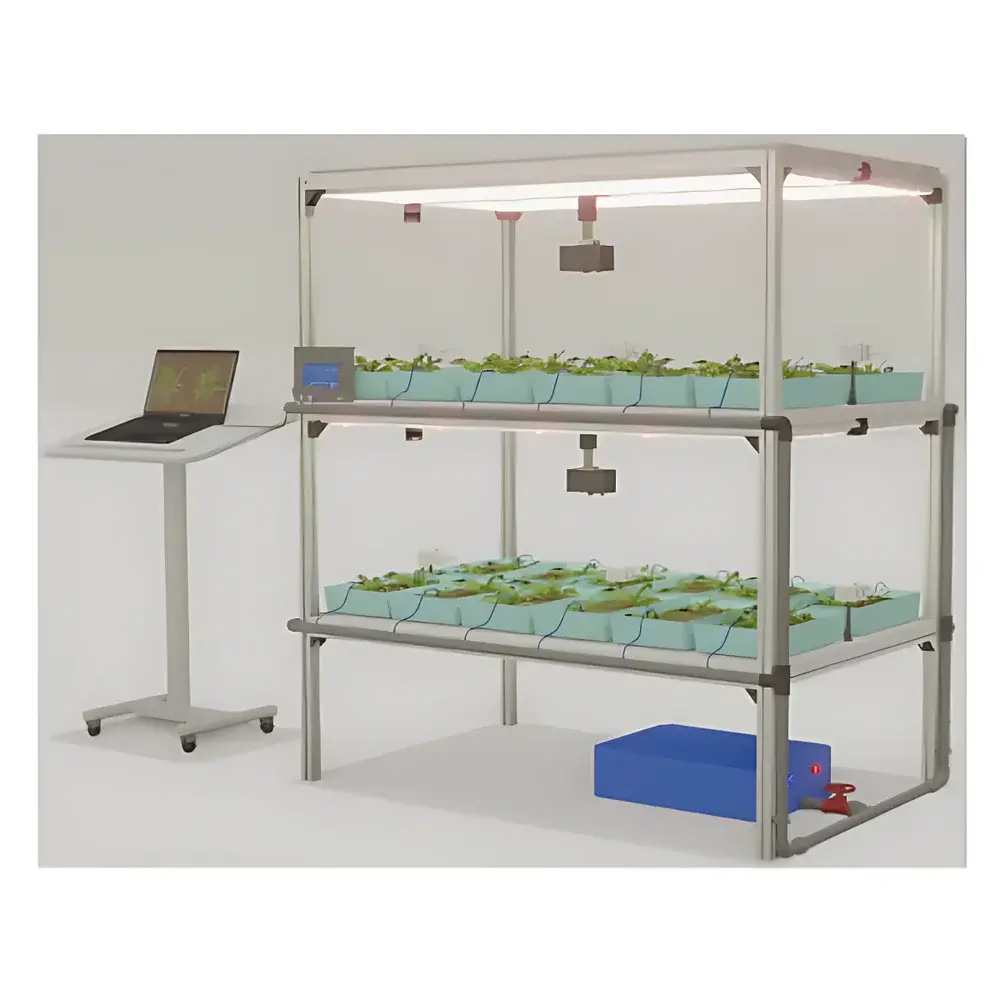
The EcoTech Digital Plant Factory Experimental Monitoring System is a fully integrated, research-grade phenotyping platform engineered for controlled-environment plant science. It operates on the principle of multi-modal, non-invasive optical sensing combined with precision environmental control—leveraging simultaneous RGB imaging, chlorophyll fluorescence (CF) imaging, visible–near-infrared (400–1000 nm) and short-wave infrared (900–1700 nm) hyperspectral imaging, and optional UV-induced multicolor fluorescence (UV-MCF) to quantify morphological, physiological, and biochemical traits across plant developmental stages. Designed specifically for plant factory R&D, vertical farming simulation, photobiology, and high-throughput phenotyping, the system enables reproducible, time-series monitoring under programmable spectral, intensity, and temporal light regimes—supporting both fundamental research (e.g., light signaling, stress physiology) and translational applications (e.g., cultivar screening, nutrient optimization, climate resilience assessment).
Key Features
- Multi-channel programmable LED illumination system: Standard configuration includes cool white + red + far-red channels (0–500 µmol·m⁻²·s⁻¹ PAR, 0–100% dimming), with optional RGB or RGB+FR 4-channel customization; supports diurnal rhythm simulation and pre-loaded lighting protocols (e.g., forest understory, overcast sky)
- Embedded dual-control architecture: Touchscreen HMI with full Chinese GUI + Windows-based PC software; wireless connectivity (Wi-Fi/Ethernet) for remote operation and real-time data synchronization
- Modular sensor integration: Interchangeable imaging modules—including 1080p RGB surveillance, CF imaging (Fo, Fm, Fv/Fm, Y(II), NPQ, Rfd), 400–1000 nm hyperspectral imaging (NDVI, PRI, PSRI, SIPI, CRI, ARI, NDNI, WBIR), SWIR (900–1700 nm) for water/N status, and UV-MCF for secondary metabolite profiling
- Digital cultivation ecosystem compatibility: Optional iPOT smart pots based on lysimetric principles—measuring real-time weight change, substrate moisture & temperature, leaf temperature, sap flow, and gas exchange parameters
- Environmental actuation suite: Integrated HVAC, CO₂ dosing, automated irrigation/fertigation subsystems with soil water potential, volumetric water content, and gravimetric sensors for closed-loop water-nutrient delivery
- Cloud-enabled AIoT framework: Edge-computed image preprocessing, encrypted data upload to secure cloud storage, role-based access control, and RESTful API support for LIMS/ELN integration
Sample Compatibility & Compliance
The system accommodates seedlings, rosette-stage herbs, young trees, and clonal cuttings up to 1.2 m height within standard 180 × 60 cm imaging chambers (custom dimensions available). All optical modules comply with IEC 62471 photobiological safety standards for LED-based excitation sources. Data acquisition workflows adhere to GLP-aligned metadata tagging (ISO/IEC 17025 traceability principles), and optional audit trail logging meets FDA 21 CFR Part 11 requirements for regulated agricultural biotechnology studies. Hyperspectral data formats conform to ENVI-compatible BIL/BIP storage, enabling interoperability with open-source tools (e.g., Python scikit-image, R hyperSpec).
Software & Data Management
SpectrAPP and FluorVision are proprietary analysis suites supporting spectral unmixing, ROI-based quantification, geometric calibration, histogram frequency analysis, and automatic peak-ratio derivation across >90 vegetation indices and fluorescence parameters. Both applications implement ISO 11146-compliant beam profiling algorithms for uniformity correction and include batch-processing pipelines for longitudinal datasets. Raw image stacks are stored with embedded EXIF metadata (timestamp, irradiance log, chamber RH/T, CO₂ setpoint), while processed outputs export to CSV, HDF5, or MIAME-compliant XML for FAIR data sharing. Software updates are delivered via signed OTA packages with SHA-256 integrity verification.
Applications
- Controlled-environment plant factory optimization: Light recipe development, yield prediction modeling, and energy-use efficiency benchmarking
- High-throughput phenotyping in breeding programs: Non-destructive screening for drought tolerance, nitrogen use efficiency, or early senescence markers
- Photomorphogenesis and circadian biology: Quantitative assessment of phytochrome- and cryptochrome-mediated responses under dynamic spectra
- Stress physiology research: Detection of oxidative stress via NPQ kinetics, osmotic stress via SWIR-derived water indices, and pathogen-induced metabolic shifts via UV-MCF ratios
- Digital twin validation: Ground-truthing of canopy-level simulations using synchronized RGB + thermal + fluorescence fusion datasets
- Regulatory-compliant crop improvement trials: Supporting OECD GLP-compliant dossier generation for novel food or bio-stimulant registration
FAQ
Is the system compliant with international data integrity standards for regulatory submissions?
Yes—optional audit trail, electronic signature, and 21 CFR Part 11 mode can be enabled upon installation and validated per client SOPs.
Can the hyperspectral modules be calibrated in-house?
All VIS-NIR and SWIR sensors ship with NIST-traceable reflectance standards and include built-in dark-current and flat-field correction routines; field recalibration requires only a Spectralon panel and takes <2 min.
What is the maximum frame rate for chlorophyll fluorescence kinetic imaging?
The CF module acquires full-frame (1392 × 1040 px) saturation pulses at 100 Hz, enabling OJIP transient analysis with 10-ms temporal resolution.
Does the system support third-party sensor integration?
Yes—via Modbus TCP, RS-485, or MQTT interfaces; documented SDKs are provided for custom probe drivers (e.g., soil respiration, VOC emission sensors).
How is thermal drift compensated during long-term imaging sessions?
Active Peltier cooling maintains detector temperature within ±0.1°C; all spectral bands undergo real-time dark-frame subtraction synchronized to ambient thermal logs.