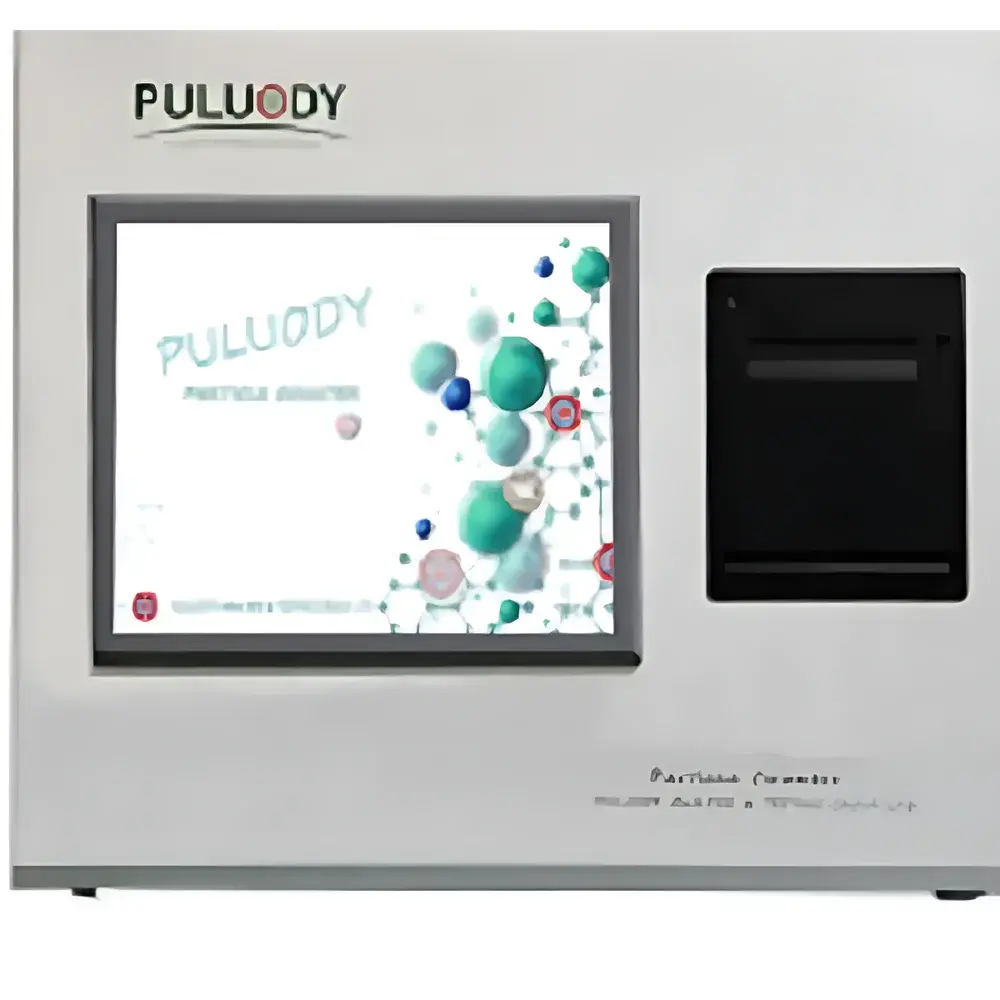
PULUODY DPC-1513-b Online Laser Particle Size Analyzer for Oilfield Water Re-injection Monitoring
| Brand | PULUODY |
|---|---|
| Model | DPC-1513-b |
| Origin | Shaanxi, China |
| Dispersion Method | Dry & Wet Dispersion |
| Instrument Type | Online Laser Particle Size Analyzer |
| Measurement Range | 1 nm – 2000 µm |
| Repeatability | < 5% |
| Measurement Time | 30–60 s |
Overview
The PULUODY DPC-1513-b Online Laser Particle Size Analyzer is an industrial-grade, dual-principle particle characterization system engineered specifically for real-time monitoring of suspended solids in oilfield water re-injection streams. It integrates two complementary optical measurement modalities: laser diffraction (ISO 13320-compliant) and dynamic flow imaging (based on hydrodynamic focusing and high-speed digital microscopy), enabling robust, multi-dimensional analysis of particle size distribution (PSD), shape parameters (e.g., circularity, aspect ratio), and concentration under continuous process conditions. Unlike offline benchtop analyzers, the DPC-1513-b is designed for permanent installation in pressurized water treatment loops—featuring a fully integrated sampling interface, self-cleaning fluidic pathways, and sealed optical measurement cells resistant to fouling from iron oxides, clay fines, and biofilm debris commonly encountered in produced water systems. Its hybrid architecture ensures traceability across both nanoscale colloids (500 µm), critical for evaluating filter integrity, corrosion inhibitor performance, and formation damage risk prior to reservoir injection.
Key Features
- Dual-mode optical detection: Simultaneous laser diffraction (for statistically representative ensemble PSD) and flow-imaging (for individual particle morphology and counting)
- Hydrodynamically focused sheath flow design: Ensures single-file particle alignment in the imaging plane, eliminating out-of-focus blur and enabling sub-pixel resolution sizing
- 7th-generation dual-laser narrow-beam detector: Optimized signal-to-noise ratio with thermal drift compensation and >50,000-hour diode lifetime
- Modular range selection: Configurable sensor modules support three operational modes—nanoscale (1–10,000 nm), micrometric (0.02–2000 µm), or full-range (1 nm–2000 µm)—with automatic optical path switching
- Integrated wet dispersion unit: Recirculating pump, ultrasonic probe (20–40 kHz), and programmable flow-rate control (0.1–5 L/min) ensure stable de-agglomeration without chemical additives
- IP65-rated enclosure with isolated electrical and hydraulic compartments: Complies with API RP 14C requirements for hazardous area instrumentation
- Serial communication interface (RS-485/Modbus RTU): Enables seamless integration into SCADA and DCS platforms for automated alarm triggering at user-defined D90 or %>5µm thresholds
Sample Compatibility & Compliance
The DPC-1513-b is validated for direct inline analysis of clarified, filtered, and biologically treated oilfield re-injection water—including low-salinity brines, polymer-flood returns, and gas-field condensate waters. It meets the metrological requirements of SY/T 5329–2012 (Recommended Water Quality Criteria for Clastic Reservoir Water Injection), Q/SY 01004–2016 (Gas Field Water Re-injection Technical Specification), and SY/T 6596–2016 (Gas Field Water Injection Technical Requirements). All optical calibrations are traceable to NIST-traceable polystyrene latex standards (PSL), and repeatability testing conforms to ISO 13320 Annex B protocols. The system supports GLP-compliant audit trails, including timestamped raw data logs, operator ID tagging, and electronic signature-capable report generation per FDA 21 CFR Part 11 guidelines when deployed in regulated facilities.
Software & Data Management
PULUODY ParticleView™ v4.2 software operates natively on Windows 10/11 (64-bit) and provides dual-language UI (English/Chinese) with role-based access control. It features automated workflow sequencing—covering auto-alignment, background subtraction, concentration optimization, real-time signal validation, and ISO-standardized inversion algorithms (Mie theory for spherical particles; Fraunhofer approximation for coarse non-absorbing materials). Data outputs include cumulative and differential distributions, statistical descriptors (D10, D50, D90, D97, span), specific surface area (m²/g), and shape metrics (circularity, convexity, aspect ratio). Reports export to PDF, CSV, PNG, and XML formats; historical datasets are stored in encrypted SQLite databases with configurable retention policies and ODBC connectivity for LIMS integration.
Applications
- Real-time verification of filtration efficiency across cartridge, media, and membrane units
- Monitoring of iron sulfide (FeS) and calcium carbonate (CaCO₃) scaling potential during water handling
- Quantification of suspended solids breakthrough during backwash cycles
- Validation of biocide dosing efficacy via time-series changes in microbial floc size distribution
- Supporting root-cause analysis of formation damage incidents through pre- and post-injection PSD comparison
- Calibration reference for online turbidity and SDI sensors in water quality management systems
FAQ
What particle size standards are supported for calibration verification?
NIST-traceable polystyrene latex (PSL) standards in sizes 100 nm, 500 nm, 1 µm, 10 µm, and 100 µm are recommended; calibration certificates include uncertainty budgets per ISO/IEC 17025.
Can the instrument operate continuously under high-pressure injection line conditions?
Yes—rated for continuous operation at up to 10 MPa (1450 psi) and 80 °C; optional Hastelloy C-276 wetted parts available for sour service environments.
Is remote diagnostics and firmware update capability included?
Yes—via secure TLS-enabled web interface with SSH tunneling; firmware updates require cryptographic signature verification before installation.
How is sample carryover minimized between measurements?
The system performs a 3-stage purge cycle (high-flow rinse → ultrasonic cavitation → air blow-down) with programmable dwell times; residual mass is verified via baseline scattering intensity.
Does the software support statistical process control (SPC) charting?
Yes—X-bar/R charts, CUSUM, and EWMA plots are embedded with configurable control limits and automatic out-of-spec alerts.


