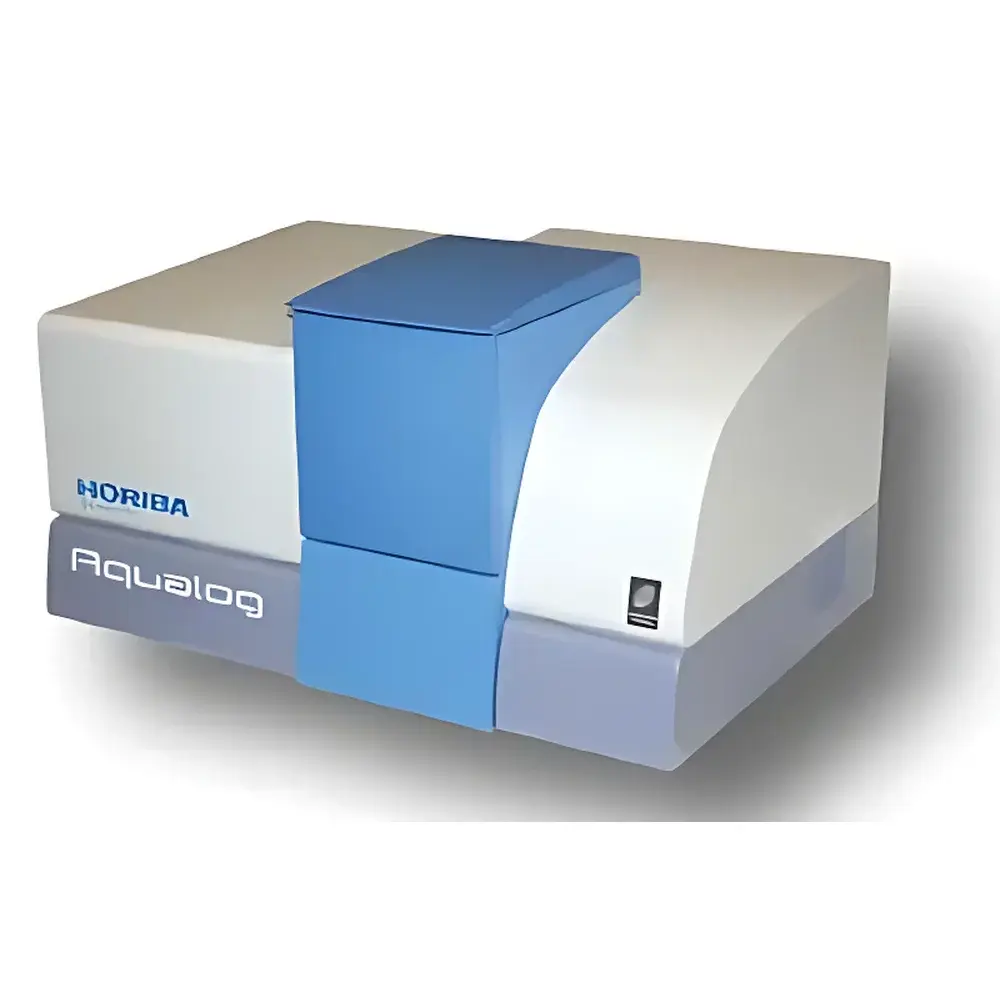
HORIBA AquaLog Dual-Mode 3D Fluorescence and UV-Vis Absorption Spectrometer
| Brand | HORIBA |
|---|---|
| Origin | USA |
| Distributor Type | Authorized Distributor |
| Instrument Type | Imported |
| Model | AquaLog |
| Wavelength Range (Excitation) | 200–800 nm |
| Wavelength Range (Emission) | 250–800 nm |
| Wavelength Range (Absorption) | 230–800 nm |
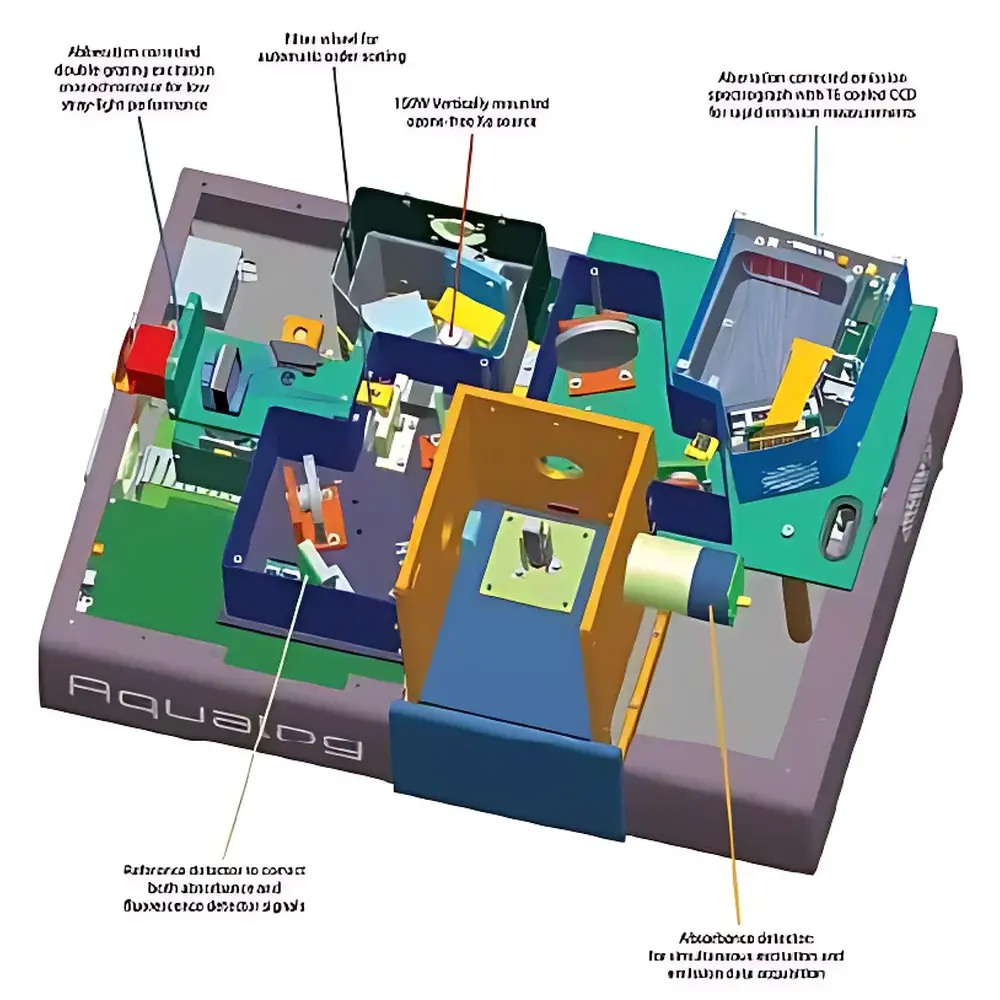
| Excitation Monochromator | Dual-grating with automatic order-sorting filter wheel |
| Emission Monochromator | CCD-based spectrometer with 405 g/mm grating (blazed at 250 nm) |
| Spectral Bandwidth (Slit) | 5 nm |
| Spectral Resolution | 0.41 nm/pixel (configurable to 0.82, 1.64, 3.28 nm/pixel) |
| Wavelength Accuracy | ±1 nm |
| Signal-to-Noise Ratio | >20,000:1 (RMS, 350 nm excitation, water Raman peak) |
| Full EEM Acquisition Time | 30 s |
| Full Emission Spectrum Readout Time | 5 ms |
| Detector | TE-cooled back-illuminated CCD |
| Built-in Corrections | Dark current, excitation source drift, excitation/emission spectral response, inner-filter effect, 1st/2nd-order Rayleigh scatter zeroing, Raman peak subtraction |
Overview
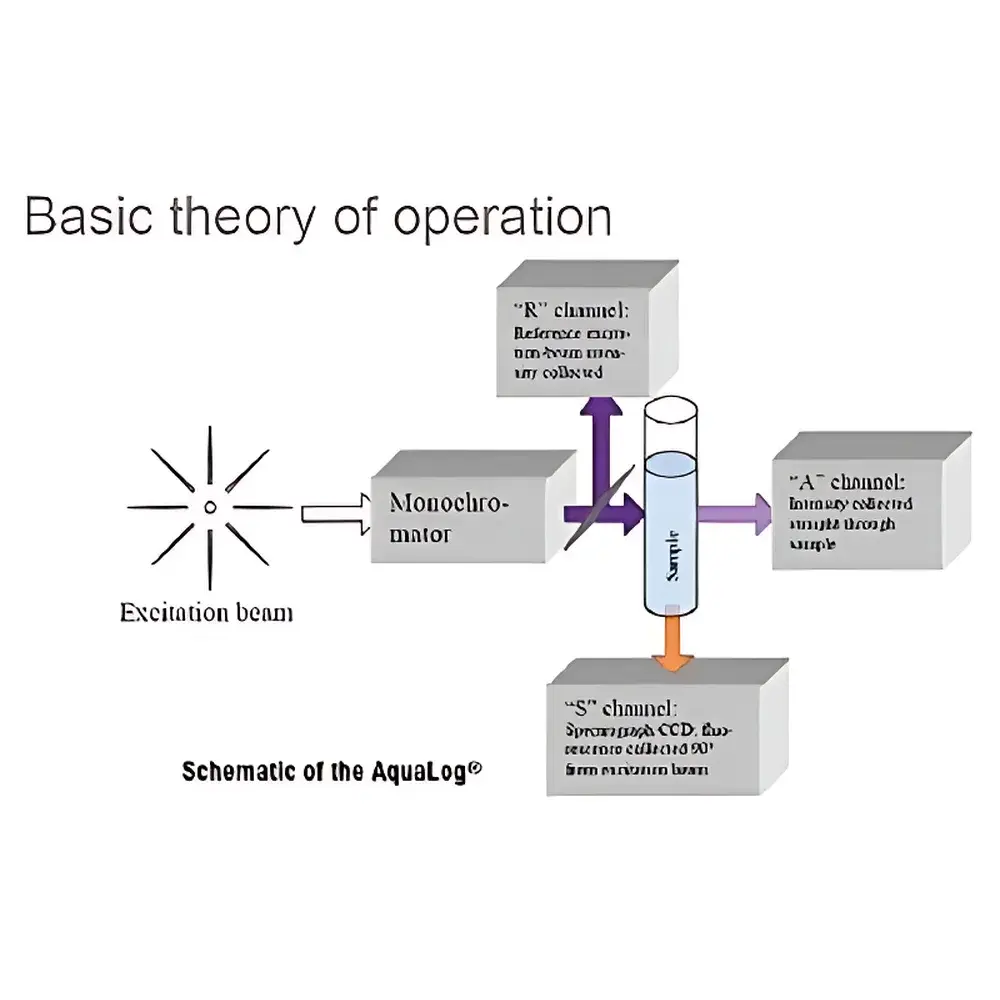
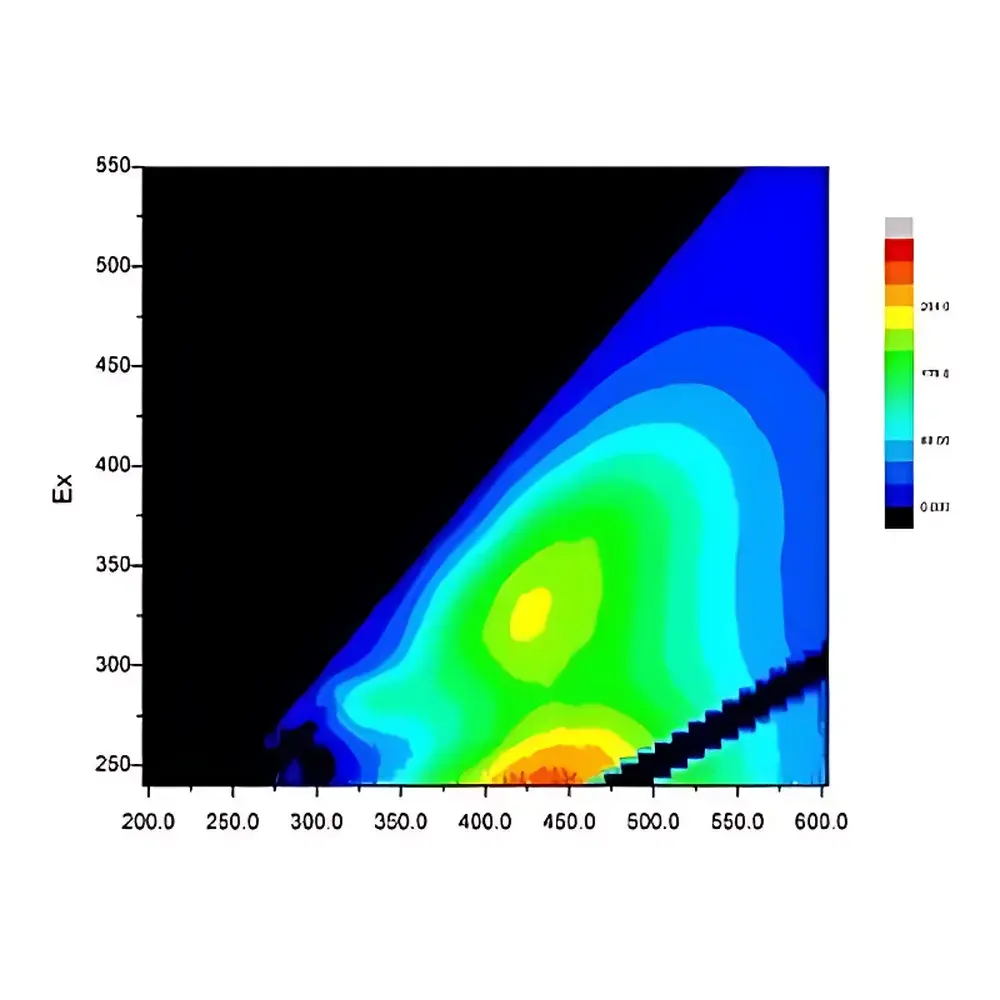
The HORIBA AquaLog Dual-Mode 3D Fluorescence and UV-Vis Absorption Spectrometer is an engineered platform for quantitative molecular fluorescence analysis in complex matrices. It uniquely integrates synchronous acquisition of excitation-emission matrix (EEM) spectroscopy—commonly referred to as three-dimensional fluorescence—with simultaneous UV-Vis absorption spectroscopy. This dual-mode architecture operates on the principle of controlled photon excitation (via a stabilized 150 W continuous xenon lamp with rear-reflecting ellipsoidal mirror), followed by dispersion through high-fidelity dual-grating excitation monochromators and detection using a thermoelectrically cooled, back-illuminated CCD. Unlike conventional single-mode fluorometers, the AquaLog applies real-time inner-filter correction derived from concurrent absorbance measurements—enabling rigorous quantification across wide concentration ranges without manual dilution or empirical compensation. Its design directly addresses three longstanding limitations in fluorescence quantification: stray light interference at low concentrations, self-absorption artifacts at high concentrations, and non-uniform linear dynamic ranges across multi-component systems. The instrument delivers physically consistent EEM volumes (not just peak intensities), supporting stoichiometric interpretation in environmental, pharmaceutical, and biochemical applications.
Key Features
- Dual-grating excitation monochromator with automated order-sorting filter wheel ensures spectral purity and eliminates higher-order diffraction artifacts.
- Simultaneous EEM and absorption data acquisition enables physics-based inner-filter correction without sequential scanning delays.
- TE-cooled back-illuminated CCD detector provides 0.41 nm/pixel resolution (scalable to coarser binning modes) and >20,000:1 RMS signal-to-noise ratio at the water Raman peak (350 nm excitation).
- Full EEM scan completed in ≤30 seconds; full emission spectrum readout in 5 ms—enabling kinetic studies and high-throughput screening.
- Automated 1st- and 2nd-order Rayleigh scatter zeroing and Raman peak subtraction eliminate baseline distortions without user intervention.
- Comprehensive built-in calibration suite traceable to NIST Standard Reference Materials (SRMs 2940–2943, RM-QS00, SRM 931g, RM-06HLKI) for excitation/emission spectral response, absorbance linearity, and S/N validation.
- Real-time excitation source monitoring and dynamic spectral response correction compensate for lamp aging and optical path drift.
Sample Compatibility & Compliance
The AquaLog accommodates standard 1-cm quartz cuvettes, fiber-optic probes, flow cells, and microvolume adapters—supporting liquid, colloidal, and semi-transparent solid samples. Its dual-mode capability meets method requirements under EPA Method 445.0 (CDOM quantification), ASTM D5907 (dissolved organic carbon estimation), and ISO 10678 (fluorescence characterization of natural waters). Data integrity complies with GLP/GMP principles: audit trails, electronic signatures, and version-controlled calibration logs are maintained within the native software environment. While not FDA 21 CFR Part 11–certified out-of-the-box, the system supports configuration for regulated environments via optional secure user authentication and encrypted raw-data archiving modules.
Software & Data Management
Acquisition and processing are performed using HORIBA’s Aqualog Software v5.x, which embeds origin-compatible mathematical functions (including PCA, PARAFAC, and MCR-ALS) and exports fully annotated HDF5 and ASCII formats. All corrections—including dark current subtraction, excitation source normalization, spectral responsivity mapping, and inner-filter modeling—are applied transparently during acquisition. Raw EEMs retain unprocessed detector counts and metadata (integration time, slit width, temperature, lamp hours). Exported datasets include calibrated absorbance spectra (A = log10(I0/I)), corrected EEMs (intensity in Q units relative to quinine sulfate), and Raman-normalized fluorescence quantum yields. The software supports batch processing of multi-sample EEM libraries and generates compliance-ready reports with embedded SRM verification results.
Applications
- Quantitative CDOM (colored dissolved organic matter) profiling in drinking water treatment, reservoir monitoring, and marine biogeochemistry—correlating EEM volume integrals with TOC and disinfection byproduct precursor potential.
- Multi-component analysis of humic substances, amino acids, and polycyclic aromatic hydrocarbons in wastewater and soil leachates.
- Stability-indicating assays for protein therapeutics, where tryptophan/tyrosine EEM signatures report on conformational integrity and aggregation onset.
- Real-time monitoring of chlorination kinetics via time-resolved EEM acquisition coupled with simultaneous absorbance tracking of residual chlorine species.
- Method development for regulatory compliance testing under US EPA, EU Water Framework Directive, and ISO environmental monitoring standards.
FAQ
How does the AquaLog correct for inner-filter effects without manual sample dilution?
It acquires absorption spectra concurrently with each EEM scan, then applies Beer–Lambert–based inner-filter correction pixel-by-pixel across the entire excitation–emission grid.
Can the AquaLog quantify multiple fluorophores in a single mixture without separation?
Yes—its high-resolution EEMs, combined with PARAFAC decomposition and inner-filter–corrected intensity scaling, enable component-specific quantification when reference spectra or constraints are available.
Is the 0.41 nm/pixel resolution fixed or configurable?
The native CCD pixel pitch corresponds to 0.41 nm/pixel at default binning; users may select 2×, 4×, or 8× hardware binning to trade resolution for increased S/N or faster readout.
What NIST-traceable standards are included for routine performance verification?
The system ships with certified reference materials for fluorescence (NIST SRMs 2940–2943, Starna RM-QS00) and absorbance (NIST SRM 931g, Starna RM-06HLKI), plus water Raman S/N validation protocols.
Does the AquaLog support kinetic EEM acquisition?
Yes—its 5-ms full-emission readout and 30-s EEM cycle allow time-resolved studies at sub-second temporal resolution when paired with external triggers or programmable reaction control modules.
Related Products

")