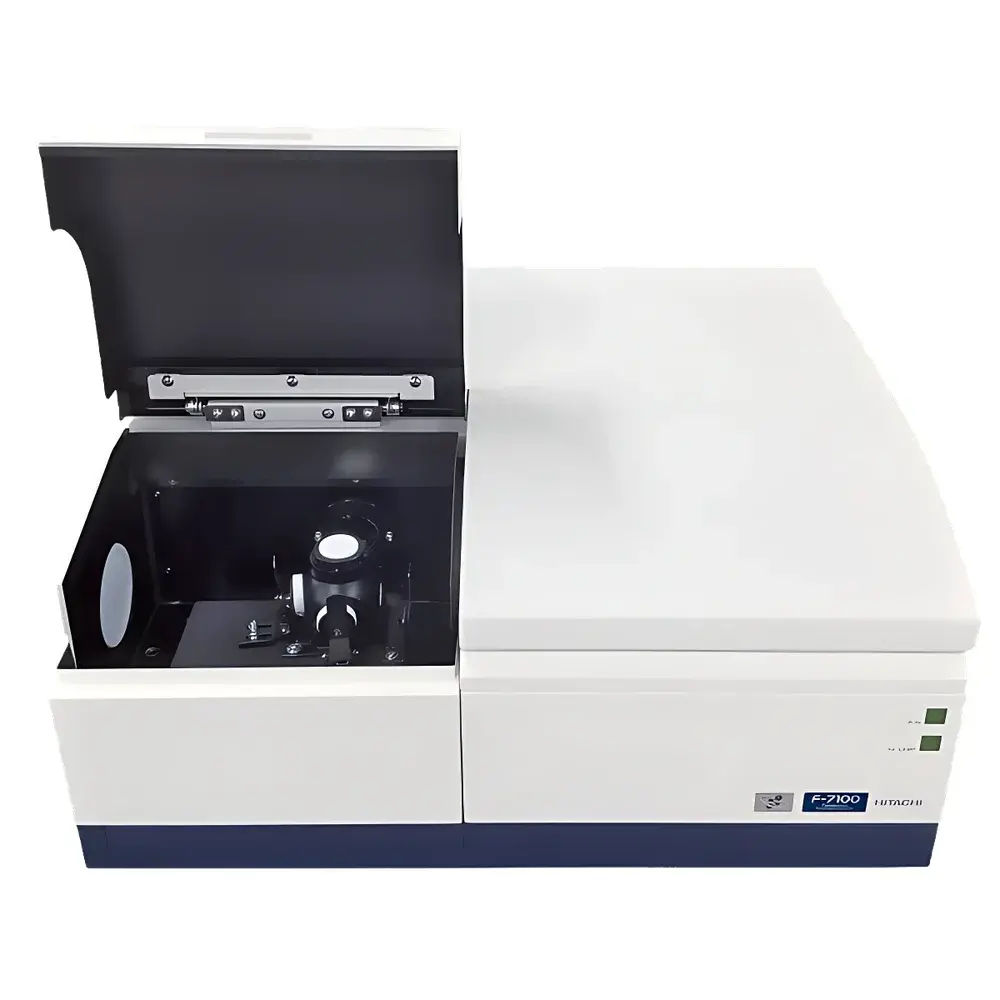
Hitachi EEM View Fluorescence Distribution Imaging System
| Brand | Hitachi |
|---|---|
| Origin | Japan |
| Manufacturer Type | Manufacturer |
| Product Category | Imported Instrument |
| Model | EEM View |
| Pricing | Upon Request |
| Dispersive Element | Grating |
| Instrument Type | Steady-State Fluorescence Spectrometer |
| Slit Width (Spectral Bandpass) | 1–20 nm |
Overview
The Hitachi EEM View Fluorescence Distribution Imaging System is a purpose-engineered modular accessory designed exclusively for integration with Hitachi F-7000 and F-7100 fluorescence spectrophotometers. It represents the first commercially deployed implementation of synchronized spatial-spectral acquisition in molecular fluorescence instrumentation—combining high-fidelity CMOS imaging with conventional steady-state fluorometric detection within a single optical architecture. The system operates on the principle of dual-channel, co-registered data capture: while the spectrophotometer’s standard photomultiplier tube (PMT) detector records wavelength-resolved fluorescence emission spectra under controlled excitation, a downward-facing scientific-grade CMOS sensor acquires spatially resolved reflectance and fluorescence images through an integrated integrating sphere illumination path. This concurrent acquisition enables pixel-level correlation between spectral signatures (360–700 nm) and spatial morphology across a Φ20 mm field of view, with an effective spatial resolution of approximately 0.1 mm. Unlike conventional fluorometers that report only ensemble-averaged intensity values over the entire illuminated area, EEM View delivers spatially resolved excitation-emission matrix (EEM) mapping—transforming qualitative visual inspection into quantitative, location-specific photophysical analysis.
Key Features
- Co-registered fluorescence spectroscopy and high-resolution imaging: simultaneous acquisition of full excitation-emission spectra and spatially resolved monochromatic or broadband images
- Integrating sphere-based uniform illumination: ensures consistent irradiance distribution across the Φ20 mm sample area for reproducible reflectance and fluorescence contrast
- AI-enhanced spectral unmixing algorithm: separates overlapping contributions from reflected excitation light and Stokes-shifted fluorescence emission at each pixel, generating independent reflectance and fluorescence image layers
- Flexible excitation modes: supports both broadband (white light) and monochromatic excitation (via grating-dispersed output from the host fluorometer), enabling comparative analysis under varied photochemical conditions
- Modular, non-invasive installation: mounts directly inside the sample compartment of Hitachi F-7000/F-7100 systems without hardware modification or recalibration of the base instrument
- Slit-width tunability (1–20 nm): allows optimization of spectral resolution versus signal-to-noise ratio depending on sample quantum yield and matrix complexity
Sample Compatibility & Compliance
EEM View accommodates solid, semi-solid, and planar heterogeneous samples—including LED substrates, coated films, polymer composites, printed electronics, pigment dispersions, and thin-film catalysts—without requiring sectioning or embedding. Sample placement is simplified via standardized mounting fixtures compatible with Hitachi’s existing sample stage infrastructure. The system adheres to ISO/IEC 17025 general requirements for competence of testing and calibration laboratories in its operational methodology, and supports traceable measurement practices when used with NIST-traceable reference standards (e.g., SRM 2036 for fluorescence quantum yield). Data integrity protocols align with GLP principles, including timestamped acquisition logs and metadata embedding (excitation wavelength, slit width, integration time, detector voltage).
Software & Data Management
The EEM View Analysis software provides a dedicated graphical interface for visualization, processing, and export of hyperspectral image cubes (x, y, λ). Core functionalities include region-of-interest (ROI) spectral extraction, false-color fluorescence intensity mapping, ratiometric analysis (e.g., F450/F620 for pigment degradation assessment), and batch-mode processing for multi-sample comparison. All raw and processed datasets are stored in vendor-neutral HDF5 format, ensuring long-term archival stability and interoperability with third-party analysis platforms (e.g., MATLAB, Python-based SciPy/NumPy workflows). Audit trails record user actions, parameter changes, and calibration events—supporting compliance with FDA 21 CFR Part 11 requirements when deployed in regulated QC environments.
Applications
- LED packaging quality control: identification of phosphor coating non-uniformity, thermal quenching zones, and interfacial delamination via spatially resolved quantum efficiency mapping
- Functional coatings and inks: quantification of pigment dispersion homogeneity, binder migration, and UV-induced photodegradation gradients
- Advanced materials R&D: characterization of luminescent MOFs, perovskite thin films, and carbon-dot composites with localized emission heterogeneity
- Forensic document analysis: differentiation of ink formulations based on spectral fingerprinting at sub-millimeter scale
- Pharmaceutical solid dosage forms: mapping of API crystallinity and excipient distribution using intrinsic fluorescence contrast
FAQ
Is EEM View compatible with fluorometers other than Hitachi F-7000/F-7100?
No. Mechanical, optical, and communication interfaces are proprietary to Hitachi’s F-series platform; retrofitting to other manufacturers’ instruments is not supported.
Does the system require external calibration standards for quantitative imaging?
Yes. Absolute fluorescence intensity calibration requires use of certified reference materials (e.g., quinine sulfate in 0.1 M H2SO4) and reflectance standards (e.g., Spectralon®). The software includes built-in routines for relative and absolute radiometric calibration.
Can EEM View acquire time-resolved fluorescence data?
No. It is designed exclusively for steady-state measurements. Time-resolved capabilities require pulsed excitation sources and TCSPC detection hardware not present in this configuration.
What is the maximum frame rate for image acquisition?
Up to 30 fps at full resolution (1920 × 1200 pixels); frame rate decreases with increasing spectral acquisition dwell time or binning mode.
Is spectral data export compatible with common chemometrics software?
Yes. Export formats include CSV (for spectral traces), TIFF (for registered images), and HDF5 (for full x-y-λ data cubes), all natively readable by Unscrambler®, Pirouette®, and open-source tools such as scikit-learn.