iSCAN Multi-Parameter In-Field Soil Physicochemical Mapping System
| Origin | USA |
|---|---|
| Manufacturer Type | Authorized Distributor |
| Origin Category | Imported |
| Model | iSCAN |
| Price Range | USD 14,000 – 28,000 |
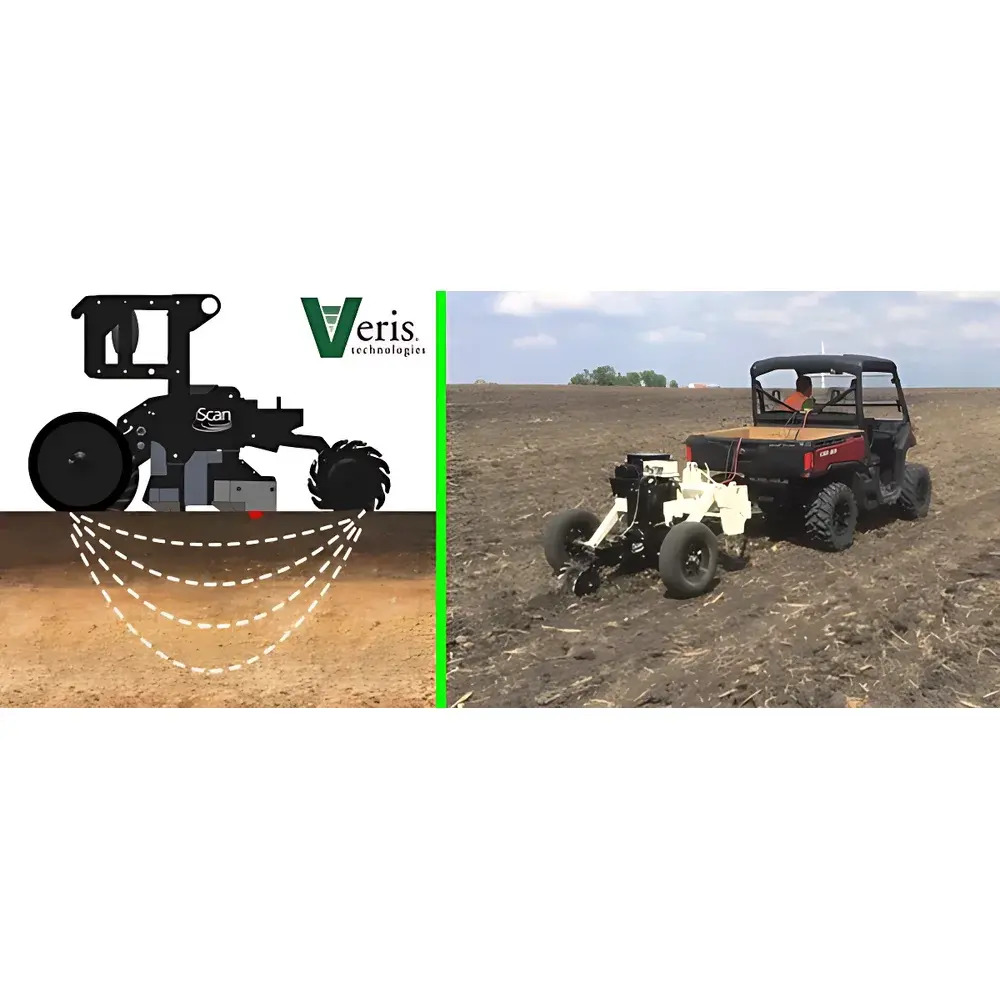
Overview
The iSCAN Multi-Parameter In-Field Soil Physicochemical Mapping System is an integrated, tractor-mounted or towed proximal sensing platform engineered for high-resolution, real-time georeferenced mapping of key soil properties across agricultural and ecological landscapes. It operates on two complementary physical principles: galvanic (contact-based) measurement of bulk electrical conductivity (EC) to infer soil texture, salinity, cation exchange capacity (CEC), and moisture regime; and visible–near-infrared (VIS-NIR) reflectance spectroscopy (660 nm and 940 nm LED illumination) to estimate surface soil organic matter (SOM) content non-destructively. Unlike laboratory-based or point-sampled analytical methods, iSCAN enables continuous, in-situ acquisition at operational speeds up to 24 km/hr — delivering spatially dense datasets (120–240 sampling points per hectare) without soil disturbance. Its architecture conforms to field-deployable instrumentation standards for long-term outdoor operation under ambient conditions (−20 °C to +70 °C), with IP67-rated electronics and MIL-spec sealed connectors ensuring reliability in dusty, humid, or rain-exposed environments.
Key Features
- Simultaneous dual-parameter mapping: bulk EC (0–60 cm depth equivalent) and SOM (38–76 mm surface layer) in a single pass
- True contact-mode EC measurement — no calibration required, minimal electromagnetic interference susceptibility, and direct correlation with soil texture, soluble salt content, and clay–silt–sand distribution
- VIS-NIR optical sensor (OpticMapper™) with narrowband 660 nm (red) and 940 nm (NIR) LEDs and 5.76 mm photodiode detector for robust spectral reflectance capture beneath crop residue
- Differential GPS positioning (Garmin GPS 15X) with sub-3-meter horizontal accuracy, enabling precise georeferencing of all measurements
- Onboard 1 Hz data acquisition via 80-pin PIC microprocessor, with backlit display and 12 VDC / 5 A power interface compatible with standard agricultural vehicle electrical systems
- Modular design: available in both implement-mounted (145 cm length) and towed configurations (259 cm length), supporting integration with planters, sprayers, or dedicated survey rigs
Sample Compatibility & Compliance
The iSCAN system is validated for use across diverse soil orders (e.g., Mollisols, Alfisols, Aridisols) and land-use contexts including row-crop fields, pasturelands, restoration sites, and carbon sequestration monitoring plots. It complies with ASTM D2434 (standard test method for permeability of soils) and ISO 11277 (soil physics — determination of particle size distribution) in terms of derived parameter interpretation. While not a certified reference method per se, its EC and SOM outputs are traceable to NIST-traceable calibration protocols applied by the VERIS Data Processing Center. All hardware meets IEC 60529 (IP67) ingress protection requirements and operates within USDA NRCS Field Equipment Performance Specifications for mobile soil sensors. The system supports GLP-aligned data integrity workflows when paired with VERIS-certified processing services.
Software & Data Management
Data acquisition and visualization are managed through SoilViewer™ software, which provides real-time display of raw EC values and spectral reflectance intensities alongside live GPS coordinates. Raw field data (including timestamp, latitude/longitude, EC, and VIS/NIR digital counts) are exported as ASCII or CSV files for downstream analysis. SOM quantification requires spectral preprocessing and multivariate calibration (PLS regression) performed exclusively at the VERIS Data Processing Center using regionally validated models. Final deliverables include GIS-compatible GeoTIFF and Shapefile layers representing interpolated 2D maps of EC, SOM, and — in iSCAN+ configuration — soil temperature and volumetric water content. All processed outputs adhere to FAO SOTER metadata conventions and support integration into Farm Management Information Systems (FMIS) compliant with ISO 11783 (ISOBUS) and AgGateway ADAPT standards.
Applications
- Precision agriculture zoning: delineation of management zones based on spatial variability of EC (salinity, texture) and SOM (fertility, C sequestration potential)
- Soil carbon flux assessment: supporting Tier 2–3 inventory reporting under IPCC 2019 Refinement guidelines through high-resolution SOM baseline mapping
- Irrigation scheduling optimization: correlating EC patterns with soil hydraulic conductivity and rooting depth estimates
- Land capability classification and land-use planning: generating spatial inputs for USDA Land Capability Classification System (LCCS) and FAO LCCS v2
- Long-term environmental monitoring: detecting decadal-scale changes in SOM stocks under conservation tillage or cover cropping regimes
- Research-grade validation: benchmarking against lab-analyzed soil cores (e.g., loss-on-ignition SOM, saturated paste EC) for methodological cross-validation
FAQ
What depth does the EC measurement represent?
The galvanic EC measurement integrates signal response from the top 0–60 cm of soil, weighted toward the upper 30 cm due to electrode geometry and current path distribution.
Is SOM estimation affected by surface residue or moisture?
The 660/940 nm dual-band ratio mitigates interference from moderate litter cover and surface wetness; however, standing water or >2 cm of fresh biomass may require post-processing correction.
Can iSCAN data be used for regulatory reporting?
While iSCAN-derived SOM maps are widely accepted for internal farm decision-making and research, formal carbon credit verification typically requires supplementary lab validation per Verra VM0042 or Climate Action Reserve protocols.
Does the system require annual recalibration?
No — the EC module is drift-free and self-referencing; the optical sensor undergoes factory spectral verification every 24 months, documented in the instrument’s Certificate of Conformance.
Is VERIS data processing mandatory for SOM output?
Yes — raw reflectance data must be submitted to the VERIS Data Processing Center, where proprietary PLS models trained on >12,000 regional soil samples generate calibrated SOM estimates with RMSE < 0.35% OM.
Related Products