LIBS Elemental Imaging Service (Geological Applications)
| Brand | Chemlab Pro |
|---|---|
| Origin | Shanghai, China |
| Manufacturer Type | Authorized Distributor |
| Product Origin | Domestic (China) |
| Model | LIBS Elemental Imaging |
| Quotation | Available upon Request |
| Service Experience | 3–5 Years |
| Spatial Resolution | 20 × 20 µm |
| Scan Area | 8 × 20 mm |
| Pixel Count | 407,000 |
| Total Scan Time | ~2 hours |
| Sample Requirements | Flat analysis surface |
| Matrix Matching | Quantitative imaging achievable for silicate and carbonate matrices with certified reference materials |
| Delivery Standard | Full-field elemental distribution maps with high spatial fidelity, minimal motion artifacts or trailing, and morphologically consistent element localization |
Overview
Laser-Induced Breakdown Spectroscopy (LIBS) Elemental Imaging is a rapid, minimally destructive micro-analytical service optimized for geological sample characterization. This service employs pulsed nanosecond laser ablation coupled with high-resolution spectrometric detection to generate spatially resolved, multi-element distribution maps across solid sample surfaces. Unlike conventional bulk techniques (e.g., XRF or ICP-MS), LIBS imaging preserves in-situ geochemical context by acquiring simultaneous spectral signatures from each ablation spot—enabling direct correlation of elemental heterogeneity with petrographic features such as mineral zoning, fracture networks, or organic-rich laminae. The Chemlab Pro LIBS imaging platform is engineered for precision raster scanning at 20 µm step resolution, delivering sub-millimeter chemical contrast over scan areas up to 8 mm × 20 mm. It is particularly suited for shale, carbonate reservoir rocks, metamorphic thin sections, and weathered regolith samples where lateral compositional gradients govern diagenetic history, fluid migration pathways, or resource potential.
Key Features
- High-fidelity spatial resolution of 20 × 20 µm per pixel, enabling visualization of fine-scale mineralogical boundaries and micro-fracture-associated element enrichment.
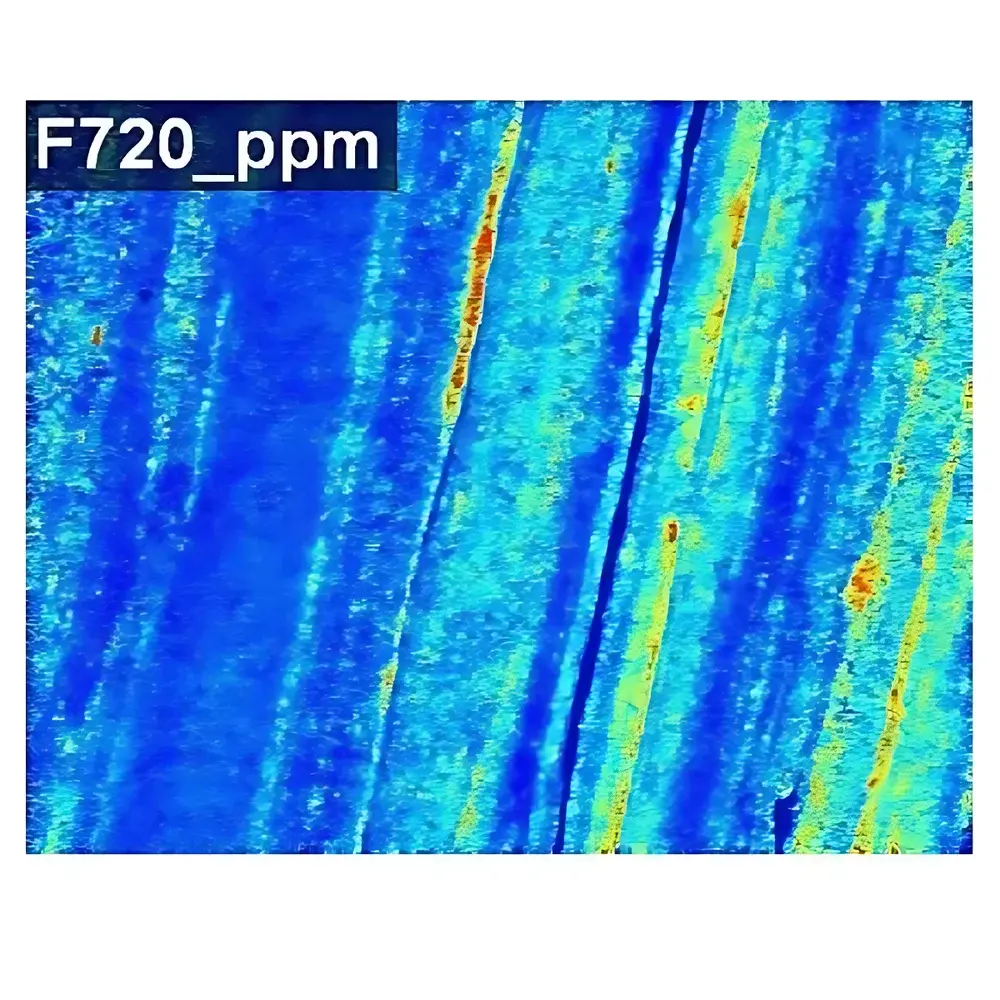
- Multi-elemental mapping capability covering major oxides (Si, Al, Fe, Ca, Mg, Na, K), trace metals (Mn, Sr, Ba, V, Cr, Ni, Cu, Zn), and light elements (Li, B, C, N, O, F) in a single acquisition.
- Minimal sample preparation: only planar surface polishing required—no conductive coating, vacuum chamber loading, or chemical digestion necessary.
- Quantitative calibration supported for silicate and carbonate matrices using NIST-traceable geological reference materials (e.g., USGS GSD series, MPI-DING glasses).
- Robust signal normalization via internal plasma parameter monitoring (e.g., continuum background intensity, electron temperature estimation) to mitigate shot-to-shot laser energy fluctuations.
- Integrated spectral deconvolution algorithms for overlapping emission lines (e.g., Fe I 371.99 nm / Cr I 372.19 nm), ensuring accurate peak assignment in complex geological spectra.
Sample Compatibility & Compliance
This service accepts polished thin sections, epoxy-mounted rock chips, and slabbed core material meeting dimensional limits (≤9 cm × 9 cm × 2.5 cm). Samples must present a flat, optically uniform analysis surface; curvature or topographic relief exceeding ±5 µm induces focal drift and spatial blurring. All analyses are performed under ISO/IEC 17025-compliant laboratory procedures, including documented instrument calibration verification before each batch, certified reference material (CRM) bracketing, and operator competency records. Data reporting aligns with ASTM D7348–22 (Standard Practice for Laser-Induced Breakdown Spectroscopy Analysis of Geological Materials) and supports GLP audit readiness through full metadata logging (laser fluence, gate delay, integration time, ambient atmosphere).
Software & Data Management
Acquired spectra are processed using Chemlab Pro’s proprietary LIBS Suite v4.2, which includes automated spectral alignment, background subtraction, multivariate curve resolution (MCR), and PCA-based anomaly detection. Output deliverables include: (i) calibrated grayscale and false-color elemental maps (TIFF, GeoTIFF); (ii) ASCII-formatted pixel-wise intensity matrices; (iii) integrated spectral libraries per sample region-of-interest; and (iv) QC reports containing CRM recovery rates (±15% tolerance), signal-to-noise ratios (>50:1 for major elements), and spatial registration accuracy (<1 µm RMS error). All raw data and processing logs are retained for 5 years and available upon request to support regulatory submissions or peer-reviewed publication workflows.
Applications
- Shale geochemistry: Mapping pyrite framboid distributions, clay mineral zoning (illite/smectite ratio proxies), and organic carbon hotspots via C/N/S intensities.
- Carbonate diagenesis: Visualizing dolomitization fronts, cement stratigraphy, and trace element partitioning (e.g., Mn²⁺/Fe²⁺ redox proxies) across pore-throat networks.
- Metamorphic petrology: Resolving garnet growth zoning (Mg-Mn-Fe exchange), symplectite reaction textures, and retrograde fluid infiltration patterns.
- Mineral exploration: Identifying pathfinder element halos (As, Sb, Hg) around sulfide veins and distinguishing hydrothermal alteration types (propylitic vs. argillic).
- Environmental geoscience: Assessing heavy metal mobility in mine tailings, Pb-Zn-Cd co-distribution in contaminated soils, and As speciation gradients in reducing aquifer sediments.
FAQ
What sample preparation is required prior to submission?
Polished, flat surfaces are mandatory. Unmounted samples should be cut and ground to ≤2.5 cm thickness; mounted samples must be fully cured and free of epoxy overflow on the analysis face.
Can quantitative results be reported for non-silicate matrices (e.g., phosphorites or evaporites)?
Yes—but quantification requires matrix-matched CRMs. Semi-quantitative results (relative intensity units normalized to internal standard lines) are provided by default for unmatched matrices.
How are detection limits determined for each element?
Method detection limits (MDLs) are calculated per ASTM D7348 Annex A2 using 3σ of blank signal variability across ≥10 ablation sites on certified low-concentration reference materials.
Is depth profiling available alongside lateral imaging?
No—this service is strictly 2D surface mapping. Depth-resolved analysis requires sequential layer-by-layer ablation, which is offered as a separate vertical profiling add-on.
Are raw spectra files included in the final deliverables?
Yes. All unprocessed spectral stacks (.csv and .spc formats), along with acquisition metadata (.xml), are delivered with the report package.


