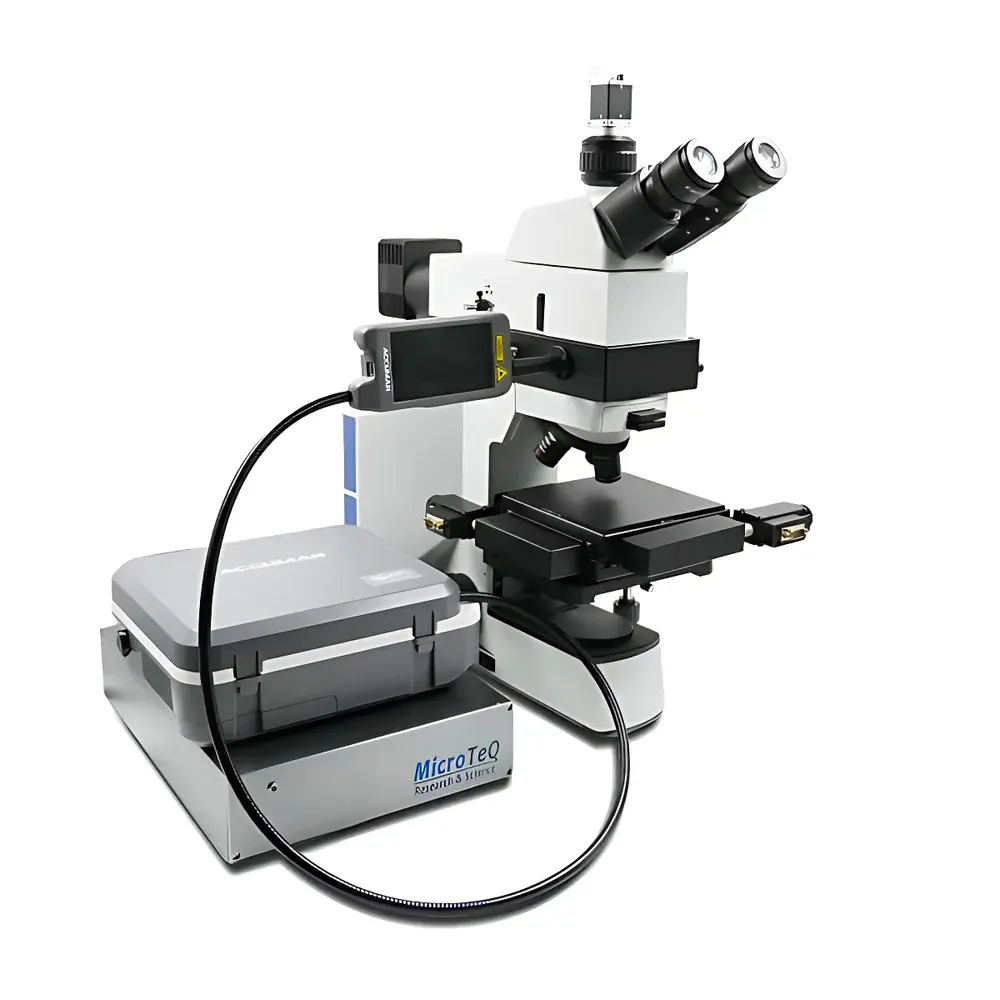
Ocean Optics MicroTEQ-S1 Micro-Raman Spectroscopy System
| Brand | Ocean Optics |
|---|---|
| Origin | Shanghai, China |
| Manufacturer Type | Original Equipment Manufacturer (OEM) |
| Product Category | Domestic |
| Model | MicroTEQ-S1 |
| Instrument Type | Grating-Based Raman Spectrometer |
| Spectral Range | 400–1100 nm |
| Spectral Resolution | ~10 cm⁻¹ @ 5 µm slit |
| Spatial Resolution | 0.14–7.7 nm (dependent on objective magnification and laser wavelength) |
| Minimum Wavenumber Shift | 200 cm⁻¹ |
| Spectral Reproducibility | Not specified |
Overview
The Ocean Optics MicroTEQ-S1 Micro-Raman Spectroscopy System is a modular, research-grade confocal microspectroscopy platform engineered for high-fidelity spatially resolved Raman, fluorescence, and reflectance measurements at the microscopic scale. Built upon a robust inverted or upright microscope architecture, the system integrates a high-sensitivity spectrometer, tunable excitation lasers (405 nm, 450 nm, 532 nm, and 785 nm), precision optical filtering, and motorized stage control into a single coordinated measurement environment. Its core measurement principle relies on inelastic light scattering (Raman effect) induced by monochromatic laser excitation, with spectral dispersion achieved via high-efficiency holographic gratings and detection performed using back-illuminated, deep-depletion CCD sensors. The system supports full wavenumber calibration traceable to NIST-traceable standards and operates within ambient laboratory conditions without requiring cryogenic cooling or vacuum enclosures—making it suitable for routine QC, academic research, and regulated development workflows.
Key Features
- Multi-modal spectroscopic capability: simultaneous and interchangeable Raman, fluorescence, and reflectance/absorbance measurements using shared optical pathways and reconfigurable fiber-coupled inputs.
- Four-laser excitation flexibility: integrated 405 nm, 450 nm, 532 nm, and 785 nm diode lasers—each with adjustable output power (up to 500 mW at 785 nm), narrow linewidth (10,000 h lifetime—enabling optimal signal-to-noise ratio across diverse sample classes (e.g., resonance Raman for biological pigments, low-fluorescence 785 nm for carbonaceous materials).
- High-resolution microspectroscopy: equipped with four parfocal, infinity-corrected achromat objectives (5×, 10×, 20×, 50×; NA 0.15–0.55), supporting diffraction-limited spatial resolution down to ~0.14 nm lateral resolution (theoretical, dependent on λ and NA) and precise depth sectioning.
- Modular QE Pro spectrometer options: selectable configurations including QEPRO@532 (150–4200 cm⁻¹), QEPRO@785 (150–2000 cm⁻¹), and QEPRO-FL (300–1050 nm) — all featuring 18-bit A/D conversion, >99% linearity, 85,000:1 dynamic range, and <0.08% stray light at 600 nm.
- Automated 2D spectral mapping: optional motorized XY translation stage (50 mm × 50 mm travel, 1 µm step resolution, ±2 µm repeatability) enables programmable raster scanning for chemical imaging, phase distribution analysis, and heterogeneity quantification.
- Open architecture design: SMA905 fiber interfaces, filter wheel slots for excitation/emission bandpass selection, and free-space coupling ports allow third-party laser integration, custom filter sets, and hybrid optical path expansion.
Sample Compatibility & Compliance
The MicroTEQ-S1 accommodates a broad spectrum of solid, thin-film, liquid, and semi-transparent specimens—including biological tissues, semiconductor wafers, polymer composites, mineral inclusions, cultural heritage artifacts, and nanomaterial dispersions—without destructive preparation. Its non-contact, non-destructive measurement modality complies with ASTM E1840 (Standard Guide for Raman Microspectroscopy), ISO 21348 (Space environment — Process for determining solar irradiances), and supports GLP/GMP-aligned documentation when paired with audit-trail-enabled software (see Software & Data Management). While not pre-certified for FDA 21 CFR Part 11, the system’s hardware architecture permits validation-ready configuration through user-defined SOPs, electronic signatures, and raw data immutability protocols.
Software & Data Management
Control and analysis are executed via OceanView Spectral Suite v3.x — a Windows-based application supporting real-time spectral acquisition, multi-channel synchronization (laser on/off, stage movement, shutter control), automated background subtraction, cosmic ray removal, peak fitting (Voigt/Gaussian models), and multivariate chemometric analysis (PCA, cluster mapping). All spectra are stored in vendor-neutral HDF5 format with embedded metadata (wavelength calibration, laser power, integration time, objective ID, stage coordinates). Export options include CSV, TXT, and JCAMP-DX for interoperability with MATLAB, Python (via h5py), and commercial cheminformatics platforms. For regulated environments, optional add-ons provide electronic lab notebook (ELN) integration, 21 CFR Part 11-compliant user access controls, and full audit trail logging of instrument parameters and processing steps.
Applications
- Materials Science: Phase identification in 2D materials (graphene, MoS₂), stress/strain mapping in microelectronics, crystallinity assessment in perovskite thin films.
- Life Sciences: Label-free cellular phenotyping, lipid droplet distribution in live plant leaves, protein secondary structure analysis in fixed tissue sections.
- Cultural Heritage: Pigment identification in historical manuscripts and gemstone provenancing via characteristic Raman fingerprints.
- Microfluidics: In situ reaction monitoring within PDMS channels using integrated capillary probes and flow-cell-compatible optics.
- Nanotechnology: Plasmonic enhancement mapping, size-dependent phonon confinement in quantum dots, and surface-enhanced Raman scattering (SERS) substrate characterization.
- Pharmaceuticals: Polymorph screening of active pharmaceutical ingredients (APIs), excipient compatibility testing, and tablet coating uniformity verification.
FAQ
Can the MicroTEQ-S1 be used for quantitative Raman analysis?
Yes—when calibrated with certified reference standards (e.g., silicon at 520.7 cm⁻¹, cyclohexane C–H stretch), the system supports relative and absolute intensity quantification under controlled illumination geometry and integration parameters. Internal standard normalization and multivariate regression models further enhance reproducibility across instruments.
Is the system compatible with external detectors or third-party spectrometers?
The optical interface supports standard SMA905 and FC/PC fiber couplings, enabling direct integration with OEM spectrometers or intensified CCD/CMOS cameras. Free-space input ports permit collimated beam coupling for custom interferometric or time-resolved extensions.
What is the typical acquisition time per spectrum in mapping mode?
At 1 s integration time and 10 µm step size over a 100 × 100 µm area (100 × 100 points), total acquisition requires ~2.8 hours—including stage settling, spectral readout, and metadata tagging. Real-time binning and region-of-interest (ROI) triggering can reduce this by up to 60%.
Does Ocean Optics provide application support or method development assistance?
Yes—Ocean Optics’ Applications Lab offers remote and on-site technical consultation, method transfer services, and custom spectral library development (e.g., mineral, polymer, or pharmaceutical reference databases) under NDA.