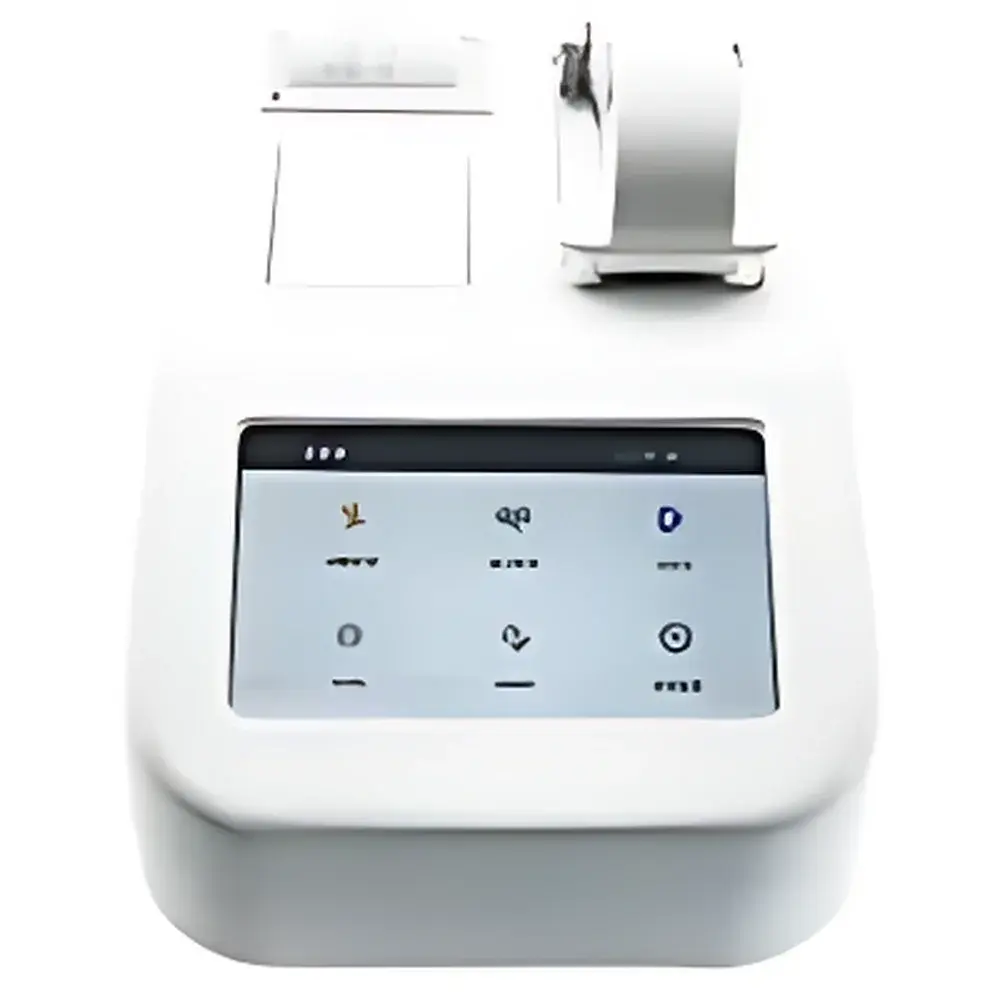
ZiQi Nano-SP2 Ultra-Micro Spectrophotometer
| Brand | ZiQi |
|---|---|
| Origin | Shanghai, China |
| Manufacturer | ZiQi Instrument Co., Ltd. |
| Model | Nano-SP2 |
| Wavelength Range | 190–850 nm |
| Wavelength Accuracy | ±1 nm |
| Pathlength Options | 0.02 mm, 0.05 mm, 0.2 mm, 1.0 mm |
| Sample Volume | 0.5–2.0 µL |
| Absorbance Range | 0–6.000 Abs |
| Absorbance Accuracy | ±1% (at 7.332 Abs, 260 nm) |
| Absorbance Precision | 0.003 Abs (0.2 mm pathlength) |
| OD600 Mode | 0–4.0 A |
| Detection Time | <5 s |
| Light Source | Xenon Flash Lamp |
| Detector | Hamamatsu UV-enhanced CMOS Linear Array Sensor |
| Wavelength Resolution | ≤3 nm (FWHM at Hg 546 nm) |
| Data Export | Excel-compatible table + JPG image |
| Power Supply | DC 24 V |
| Power Consumption | 25 W |
| Dimensions (W×D×H) | 200 × 260 × 165 mm |
| Weight | 5 kg |
Overview
The ZiQi Nano-SP2 Ultra-Micro Spectrophotometer is a benchtop, full-spectrum (190–850 nm) absorbance-based analytical instrument engineered for rapid, label-free quantification of nucleic acids, proteins, and microbial suspensions without sample dilution. It operates on the principle of fixed-pathlength microvolume absorbance measurement—where a precisely defined liquid column is formed between two optical surfaces (quartz fiber and hardened aluminum), enabling direct optical pathlength selection (0.02, 0.05, 0.2, or 1.0 mm) via mechanical actuation. Unlike conventional cuvette-based UV-Vis spectrophotometers requiring 50–1000 µL volumes and manual dilution, the Nano-SP2 utilizes only 0.5–2.0 µL of undiluted sample, achieving effective concentration detection limits up to 150× higher than standard 10-mm-pathlength instruments. Its xenon flash lamp delivers stable, low-thermal-load illumination with ≤3 flashes per measurement—minimizing photodegradation of light-sensitive biomolecules such as RNA and fluorescent dyes—while ensuring extended source lifetime (>10⁶ flashes). The system integrates a Hamamatsu UV-enhanced CMOS linear array detector for high signal-to-noise ratio across the deep-UV range, supporting accurate A260/A280 and A260/A230 ratio analysis in compliance with ISO 15195 and ASTM E275 for nucleic acid purity assessment.
Key Features
- Four selectable fixed pathlengths (0.02 mm, 0.05 mm, 0.2 mm, 1.0 mm) for optimal dynamic range coverage—from highly concentrated dsDNA (2–27,500 ng/µL) to dilute BSA solutions (0.06–820 mg/mL)
- Dedicated OD600 optical channel with calibrated 600 nm LED and matched photodiode, enabling precise bacterial and yeast culture density monitoring per ISO 8199 and CLSI M07-A10 standards
- Sub-5-second measurement cycle with real-time absorbance calculation and direct concentration output—no manual dilution factor application required
- UV-optimized quartz-fiber sample stage paired with hardened aluminum base ensures mechanical stability, thermal uniformity, and resistance to chemical corrosion during repeated cleaning cycles
- Onboard Android OS interface with intuitive touchscreen navigation; supports USB mass storage export of CSV tables (Excel-compatible) and annotated JPG snapshots for audit-ready documentation
- Calibration traceable to NIST-traceable reference standards; wavelength accuracy maintained within ±1 nm across full spectral range (190–850 nm), verified per ISO/IEC 17025 calibration protocols
Sample Compatibility & Compliance
The Nano-SP2 accommodates aqueous and low-viscosity organic solvent-based samples—including TE buffer, PBS, guanidine hydrochloride, and ethanol/water mixtures—without risk of capillary clogging or surface contamination. Its non-contact, open-sample architecture eliminates cross-contamination between runs and supports rapid decontamination using 70% ethanol or DNA-away reagents. All absorbance measurements comply with key regulatory frameworks for QC laboratories: data integrity meets FDA 21 CFR Part 11 requirements through timestamped, user-logged results with immutable USB export; OD600 readings align with USP endotoxin testing guidelines for bioprocess monitoring; and nucleic acid quantification workflows satisfy ISO/IEC 17025 clause 5.9.1 for measurement uncertainty estimation. The instrument’s optical design conforms to CIE S 014-2/E:2020 for spectral bandwidth characterization and ASTM E308-22 for colorimetric repeatability assessment.
Software & Data Management
The embedded Android-based software provides role-based access control (operator, supervisor, administrator), configurable report templates, and automatic metadata tagging (date/time, operator ID, pathlength, wavelength). All measurement sessions generate dual-format outputs: (1) CSV files containing raw absorbance spectra (1 nm intervals), calculated concentrations, purity ratios, and statistical summaries (n=3 default); and (2) annotated JPG images showing spectral plots overlaid with peak annotations and pass/fail flags against user-defined thresholds. Data files are stored in a hierarchical folder structure compliant with ALCOA+ principles (Attributable, Legible, Contemporaneous, Original, Accurate, Complete, Consistent, Enduring, Available). USB export enforces write-only mode to prevent accidental modification—ensuring data integrity for GLP/GMP audits. Optional PC synchronization enables integration with LIMS platforms via standard FTP or SMB protocols.
Applications
- Routine quantification of dsDNA, ssDNA, RNA, and oligonucleotides in molecular biology labs—supporting qPCR, NGS library prep, and CRISPR guide RNA validation
- Protein concentration determination using BSA, IgG, or lysozyme standard curves; compatible with Bradford, Lowry, and direct A280 methods
- High-throughput OD600 monitoring of E. coli, S. cerevisiae, and mammalian cell cultures for fermentation optimization and growth phase tracking
- Quality control of purified antibodies, viral vectors, and mRNA-LNP formulations where minimal sample consumption is critical
- Educational use in undergraduate biochemistry labs for teaching Beer-Lambert law fundamentals and spectral interpretation
- Environmental microbiology applications including activated sludge turbidity screening and algal biomass estimation
FAQ
What is the minimum detectable dsDNA concentration using the 0.02 mm pathlength?
The theoretical lower limit is 2 ng/µL (equivalent to 0.04 ng in 2 µL), assuming optimal signal-to-noise performance and proper baseline correction.
Can the Nano-SP2 measure samples in high-salt or glycerol-containing buffers?
Yes—samples with ≤1 M NaCl or ≤20% (v/v) glycerol are compatible; however, viscous or particulate-laden solutions may require additional surface cleaning between measurements.
Is third-party software integration supported?
The device exports native CSV and JPG formats; no proprietary SDK or API is provided, but file-based ingestion into Python, R, or LabVIEW is fully feasible via USB or network transfer.
How often does the instrument require recalibration?
Factory calibration remains valid for 12 months under normal operating conditions; annual verification using NIST-traceable neutral density filters is recommended for ISO/IEC 17025-accredited facilities.
Does the OD600 mode support custom wavelength selection?
No—the OD600 channel uses a dedicated 600 ± 2 nm LED and matched photodiode optimized for turbidity measurement per ISO 8199; it is not tunable.