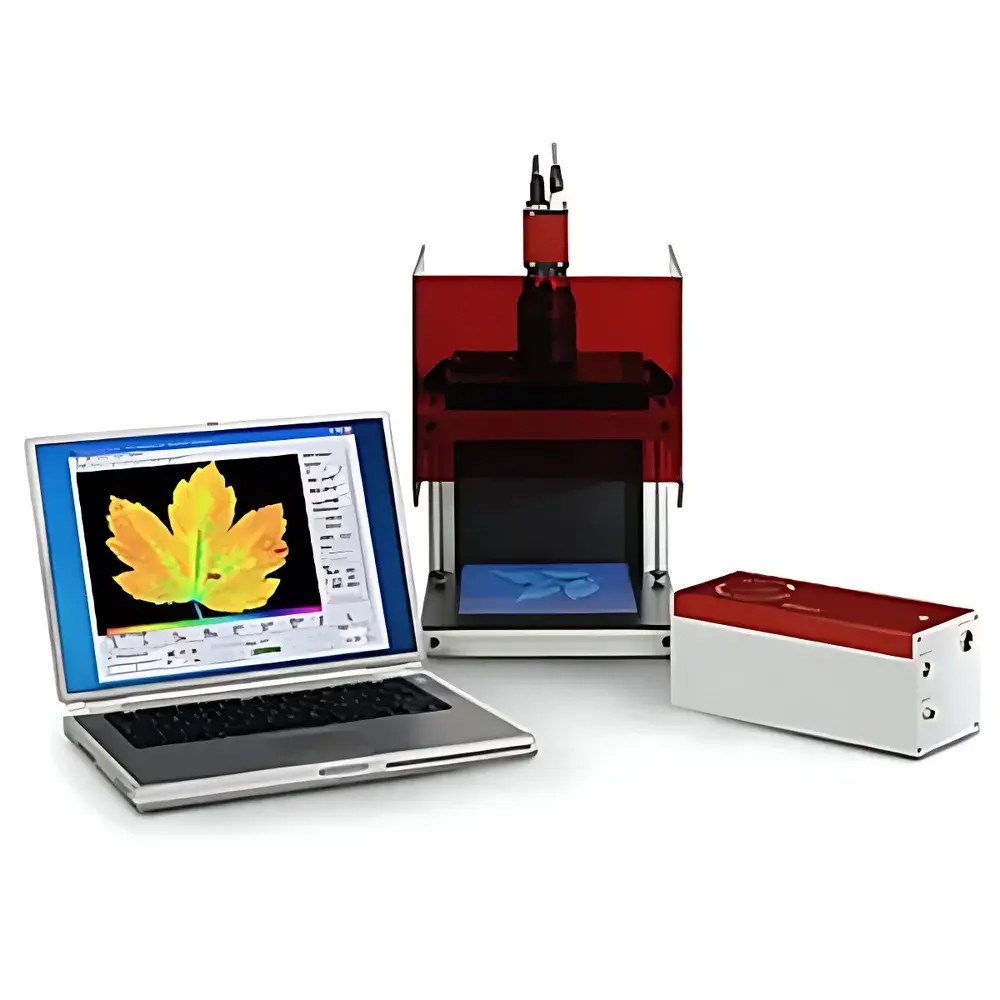
Walz M-IMAGING-PAM Chlorophyll Fluorescence Imaging System
| Brand | Walz |
|---|---|
| Origin | Germany |
| Model | M-IMAGING-PAM |
| Imaging Units | MAXI (11 × 15 cm), MINI (2.4 × 3.2 cm), MICROSCOPY (microscope-coupled) |
| Excitation Wavelengths | Blue (450–480 nm), Red (620–625 nm), GFP (480 nm), RGB (full-spectrum) |
| Compatible Sample Formats | Intact leaves, algal cultures, 96-well plates, 384-spot arrays, lichens, biological soil crusts, single cells |
| Key Parameters Imaged | Fo, Fm, Fv/Fm, F, Fm′, Y(II), Y(NPQ), Y(NO), NPQ, qN, qP, qL, ETR, Abs, NIR, Red, Inh, Ft |
| Compliance | Designed for GLP-compliant workflows |
| Software | ImagingWin v4.x with modular scripting (48 command types), AOI tools, heterogeneity analysis, time-series trend extraction, and Excel-exportable reports |
Overview
The Walz M-IMAGING-PAM is a modular, high-fidelity chlorophyll fluorescence imaging system engineered for quantitative, spatially resolved analysis of photosynthetic performance across diverse biological matrices. Based on pulse-amplitude modulation (PAM) fluorometry principles, it measures the quantum yield of Photosystem II (PSII) photochemistry by precisely controlling actinic light, saturation pulses, and measuring light intensities—enabling non-invasive, real-time mapping of photochemical efficiency (Y(II)), regulated energy dissipation (Y(NPQ)), and unregulated energy loss (Y(NO)). Since its commercial introduction in 2003, the M-IMAGING-PAM has become the most widely cited platform in peer-reviewed photosynthesis research, with over 4,000 publications indexed—including more than 2,200 entries in the Photosynthesis Research Literature Database—and consistent annual output exceeding 200 peer-reviewed articles in journals such as *Nature Plants*, *Molecular Plant*, *The Plant Cell*, *PNAS*, and *New Phytologist*. Its design adheres to fundamental optical constraints: excitation uniformity across the imaging field is maintained within ±2–7% variation, ensuring reproducible quantification independent of sample position.
Key Features
- Modular architecture supporting three interchangeable imaging units: MAXI (11 × 15 cm field-of-view, lab-based), MINI (2.4 × 3.2 cm, portable for field deployment), and MICROSCOPY (microscope-integrated for tissue sections or single-cell algal analysis)
- Dual-wavelength excitation options per unit: blue LEDs (450–480 nm) optimized for higher plants and eukaryotic algae; red LEDs (620–625 nm) for cyanobacteria, lichens, and biological soil crusts; GFP-specific excitation (480 nm) on MINI; full-spectrum RGB illumination on MICROSCOPY for spectral unmixing and microalgal population classification
- Comprehensive parameter imaging suite: simultaneous spatial mapping of ≥18 fluorescence-derived parameters including Fo, Fm, Fv/Fm, Y(II), Y(NPQ), Y(NO), NPQ, qP, qL, ETR, absorption coefficient (Abs), near-infrared (NIR), red reflectance, and inhibition index (Inh)
- Programmable kinetic protocols: customizable induction curves (manual or automated), multi-step light-response curves (up to 20 intensity steps), dark relaxation tracking, and dynamic thermal control via Phenoplate integration with thermocyclers
- Advanced data interrogation: region-of-interest (ROI) definition (rectangular, circular, polygonal), pixel-wise heterogeneity analysis, histogram-based pixel-count distribution across user-defined parameter thresholds, and time-series trend extraction per AOI
- Script-driven experimental automation: 48 modular command statements enable implementation of non-standard protocols—e.g., circadian light oscillation, sequential stress imposition, or multi-phase acclimation assays
Sample Compatibility & Compliance
The M-IMAGING-PAM accommodates a broad spectrum of photosynthetic samples without physical modification: intact vascular plant leaves, bryophyte thalli, lichen symbionts, cyanobacterial mats, planktonic and benthic microalgae (including *Chlamydomonas*, *Dunaliella*, *Synechocystis*), and structured culture formats (96-well plates, 384-spot agar arrays). Its excitation geometry and low-measurement-light intensity (<0.5 µmol photons·m⁻²·s⁻¹) preserve physiological integrity during acquisition. The system supports traceable, auditable workflows aligned with Good Laboratory Practice (GLP) frameworks. When deployed with validated electronic lab notebooks (ELNs) or LIMS, raw image stacks, metadata logs, and processed reports comply with FDA 21 CFR Part 11 requirements for electronic records and signatures. All calibration routines—including PAR absorption coefficient measurement using paired 660 nm (red) and 780 nm (NIR) LED arrays—are documented and repeatable per ISO/IEC 17025 guidance.
Software & Data Management
ImagingWin v4.x provides an integrated environment for acquisition, processing, and export. It features native support for time-lapse series, batch processing of multi-condition experiments, and hierarchical project organization. Each acquired image set includes embedded metadata (timestamp, excitation wavelength, actinic intensity, saturation pulse duration, camera gain, temperature sensor reading). AOI-based statistical summaries—mean, SD, min/max, slope of temporal change—are auto-generated and exportable to .xlsx with one click. Heterogeneity analysis permits comparative pixel-value profiling between arbitrary image locations, enabling detection of subtle spatial gradients undetectable by bulk fluorometry. Script modules allow conditional logic (e.g., “if Y(II) < 0.25 in ROI A, trigger next light step”), facilitating adaptive experimental designs. All exported datasets retain parameter definitions consistent with the Minimal Information about a Fluorescence Experiment (MIAFE) standard.
Applications
- Photosynthetic phenotyping: High-throughput screening of mutant libraries (e.g., *Arabidopsis*, rice, *Chlamydomonas*) for altered PSII efficiency, NPQ capacity, or stress resilience—using Fo/Fv/Fm contrast or Y(NO)-driven damage mapping
- Abiotic stress physiology: Quantifying early photoinhibitory responses to drought, salinity, heat, or UV exposure prior to visible symptom development
- Plant–pathogen interactions: Spatial tracking of infection progression via localized Y(II) suppression in asymptomatic tissue surrounding necrotic lesions
- Microalgal ecotoxicology: Parallel assessment of 96+ treatments in microplate format; software calculates % inhibition relative to controls for any imaged parameter
- Functional genomics: Macro-scale GFP fluorescence imaging under blue excitation, enabling correlative analysis of transgene expression and photosynthetic phenotype
- Thermal–photosynthetic coupling: Phenoplate-enabled dynamic temperature ramping during fluorescence acquisition to resolve ETR–NPQ trade-offs across thermal optima
- Gas exchange–fluorescence co-monitoring: Synchronized operation with WALZ GFS-3000 via MAXI or MINI probes for concurrent CO₂ assimilation and spatial Y(II) mapping
FAQ
What distinguishes the MAXI, MINI, and MICROSCOPY imaging units?
The MAXI unit provides the largest field of view (11 × 15 cm) and is optimized for laboratory-based leaf-level or plate-based assays. The MINI unit (2.4 × 3.2 cm) is battery-operated and ruggedized for field deployment on intact plants or soil crusts. The MICROSCOPY unit couples to upright or inverted microscopes, enabling sub-millimeter resolution on tissue sections or single algal cells.
Can the system quantify absorption coefficients for non-standard samples like cyanobacterial biofilms?
Yes—the dual-wavelength (660 nm + 780 nm) LED array enables calculation of PAR absorption coefficients for any photosynthetic matrix where diffuse transmittance can be measured, including layered biofilms and desiccated lichens.
Is remote operation supported for long-term无人值守 experiments?
ImagingWin supports scheduled acquisitions via Windows Task Scheduler; all scripts, triggers, and data paths are configurable for unattended overnight or multi-day runs with automatic folder timestamping and error logging.
How is calibration traceability maintained across instruments and laboratories?
Each unit ships with NIST-traceable irradiance calibration certificates for all LED channels. Users may perform in-house verification using calibrated silicon photodiodes; calibration metadata is embedded in every image file header.
Does the system support third-party integration with climate chambers or robotic handling platforms?
Yes—ImagingWin exposes COM interface methods and TCP/IP command protocols, enabling bidirectional communication with environmental controllers (e.g., Conviron, Weiss), liquid handlers, or conveyor-based phenotyping systems.


