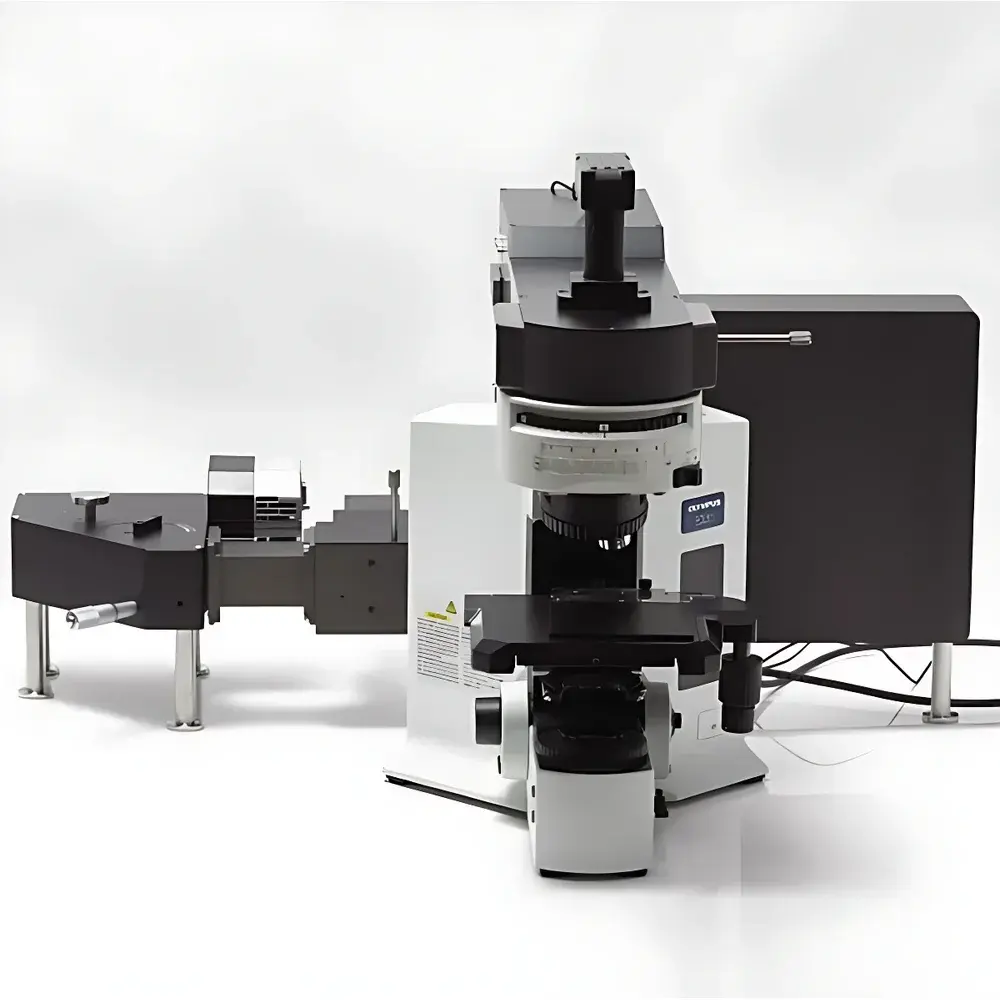
Nanobase XperRam Ultimate Confocal Raman-Photoluminescence-Photocurrent-FLIM Imaging System
| Brand | Nanobase |
|---|---|
| Origin | South Korea |
| Instrument Type | Confocal Micro-Raman Spectrometer |
| Spectral Range | 50–5900 cm⁻¹ |
| Spectral Resolution | 2.5 cm⁻¹ |
| Spatial Resolution | < 0.02 µm |
| Minimum Wavenumber | < 250 cm⁻¹ |
| Spectral Reproducibility | < 0.1 µm |
Overview
The Nanobase XperRam Ultimate is a fully integrated, modular confocal imaging platform engineered for multimodal correlative spectroscopy and nanoscale functional mapping. At its core, the system implements high-fidelity confocal Raman spectroscopy based on Couette-free transmissive optical design—eliminating alignment drift and maximizing photon throughput across the visible to near-infrared (VIS–NIR) range. Unlike conventional reflective-grating spectrometers, the Ultimate employs a volume holographic transmission grating with >90% diffraction efficiency—30% higher than standard ruled or blazed gratings—enabling superior signal-to-noise ratio (SNR) and long-term spectral stability. The system supports four synchronized measurement modalities: (1) steady-state Raman and photoluminescence (PL) spectroscopy and hyperspectral imaging; (2) time-resolved fluorescence lifetime imaging microscopy (FLIM) via time-correlated single-photon counting (TCSPC); (3) spatially resolved photocurrent mapping using precision probe station integration; and (4) simultaneous optical morphology acquisition via Olympus BX-series upright microscopes. All modalities share a common coordinate frame, enabling pixel-registered correlation of chemical composition (Raman), electronic structure (PL), carrier dynamics (FLIM), and charge transport behavior (photocurrent)—critical for materials science, semiconductor process development, and nanobiophotonics research.
Key Features
- Transmissive volume holographic spectrometer with >90% optical throughput and calibrated wavenumber accuracy ±0.5 cm⁻¹ over full 50–5900 cm⁻¹ range
- Galvanometric mirror-based scanning engine delivering < 0.02 µm lateral resolution and < 0.1 µm positional repeatability over 200 × 200 µm field-of-view
- Modular laser architecture supporting up to three independently controlled sources: narrow-linewidth CW lasers (405/532/633/785 nm, ≤100 mW) and picosecond pulsed excitation (PDL800 series, 266–1990 nm, 6 ns pulse width, 80 MHz rep rate)
- Dual-detector configuration: scientific-grade TE-cooled CCD (Andor or Princeton Instruments) for Raman/PL spectral acquisition; SPAD-based TCSPC module (25 ps timing resolution, 100 ps – 10 µs dynamic range) for FLIM
- Integrated Keithley 2400 source-measure unit (SMU) with custom probe station interface for quantitative photocurrent mapping under controlled bias and illumination conditions
- Olympus BX4X/BX5X/BX61 upright microscope platform with selectable objectives (standard 40×, NA = 0.75; optional long-working-distance and high-NA variants), LED-based epi- and trans-illumination, and >60% broadband transmission (360–1000 nm)
Sample Compatibility & Compliance
The XperRam Ultimate accommodates diverse sample formats including polished wafers, thin-film heterostructures, suspended 2D membranes, biological tissue sections, polymer composites, and microfluidic devices. Its non-contact, label-free operation ensures minimal sample perturbation—essential for in situ and operando characterization. The system complies with ISO/IEC 17025 requirements for analytical instrument validation and supports GLP/GMP-aligned workflows through audit-trail-enabled software logging. Spectral calibration adheres to NIST-traceable standards (e.g., silicon Raman peak at 520.7 cm⁻¹, neon emission lines), and all intensity data are corrected for detector quantum efficiency and grating response. For regulated environments, optional 21 CFR Part 11-compliant user access control, electronic signatures, and immutable raw-data archiving are available.
Software & Data Management
Control and analysis are unified within Nanobase’s proprietary XperSoft v5.x suite—a Windows-based application developed in C++ with Qt framework for deterministic real-time performance. The software provides synchronized hardware triggering across all modalities, automated spectral calibration routines, and batch-processing pipelines for large-area hyperspectral cubes (up to 1024 × 1024 pixels × 2048 spectral channels). Advanced analysis modules include multivariate curve resolution (MCR), principal component analysis (PCA), fluorescence decay deconvolution (multi-exponential fitting), and photocurrent histogram statistics. Export formats include HDF5 (for FAIR data principles), ASCII, and vendor-neutral .spc/.jdx for third-party tools (e.g., OriginLab, MATLAB, Python SciPy). Raw spectral and lifetime histograms are stored with full metadata (laser power, integration time, objective ID, environmental temperature) to ensure experimental reproducibility.
Applications
- Characterization of strain and doping gradients in graphene and transition metal dichalcogenides (e.g., MoS₂, WS₂) via Raman peak shift and FWHM mapping
- Correlating defect density (D/G ratio), layer count (2D peak shape), and interfacial charge transfer (PL quenching) in van der Waals heterostructures
- Quantifying carrier recombination kinetics in perovskite solar cells and quantum dot films using FLIM-guided photocurrent optimization
- Mapping local Schottky barrier height variations across MoS₂/WSe₂ lateral p–n junctions via spatially resolved photocurrent spectroscopy
- Identifying microplastic polymer types (PET, PP, PE) in environmental samples through fingerprint Raman bands and automated spectral library matching
- Assessing crystallinity and phase segregation in pharmaceutical co-crystals using Raman chemical imaging at sub-micron resolution
FAQ
What laser configurations are supported for combined Raman and FLIM measurements?
The system supports dual-laser operation: a narrow-linewidth CW laser (e.g., 532 nm) for Raman/PL excitation and a synchronized picosecond pulsed laser (e.g., 405 nm or 640 nm) for TCSPC-based FLIM—both independently modulated and temporally gated.
Can the system perform low-wavenumber Raman measurements below 200 cm⁻¹?
Yes—the optional low-wavenumber module extends detection down to < 250 cm⁻¹ with optimized notch filtering and stray-light suppression, enabling study of lattice modes in layered materials and phonon confinement effects.
Is the photocurrent mapping capability compatible with electrical biasing during optical excitation?
Yes—Keithley 2400 SMU integration allows simultaneous application of DC or AC bias (±200 V, ±1 A) while acquiring spatially resolved photocurrent, enabling dark-current subtraction, responsivity mapping, and photoconductive gain analysis.
How is spectral calibration maintained across long-duration mapping experiments?
Real-time wavelength stabilization uses an internal neon reference lamp, with automatic recalibration triggered every 30 minutes or upon thermal drift detection (>0.1 cm⁻¹ deviation), ensuring traceable accuracy throughout multi-hour acquisitions.
Does the software support batch processing of FLIM decay curves using global fitting algorithms?
Yes—XperSoft includes built-in iterative reconvolution fitting with variable exponential models (1–4 components), χ² minimization, and residual error mapping, exportable as parameter images (amplitude, lifetime, fractional contribution).