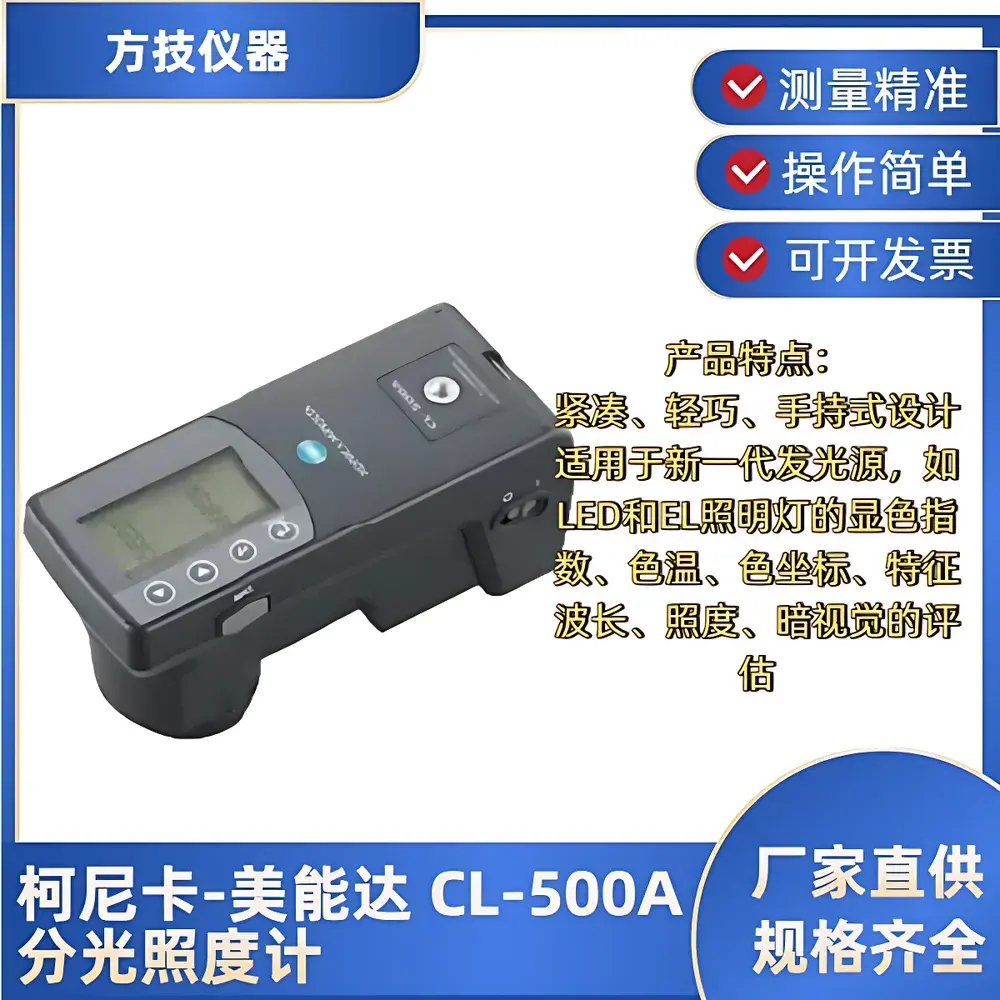
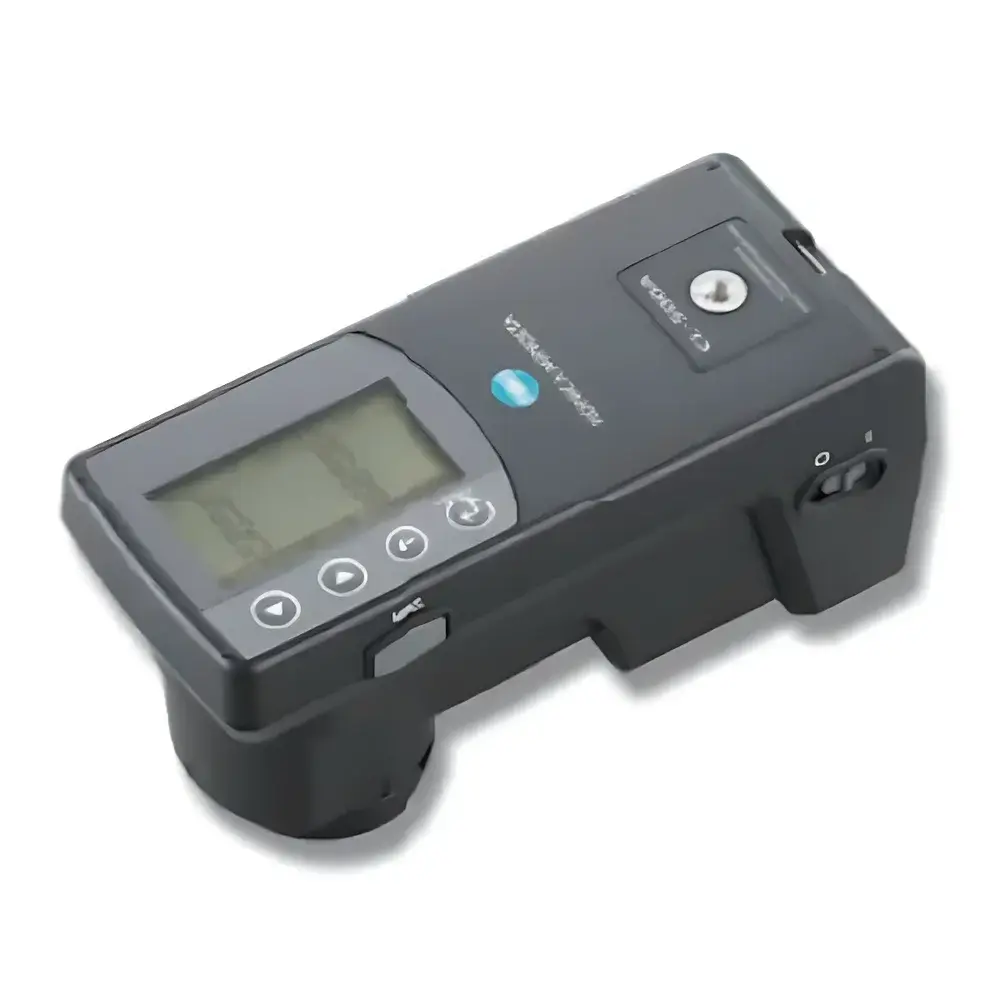
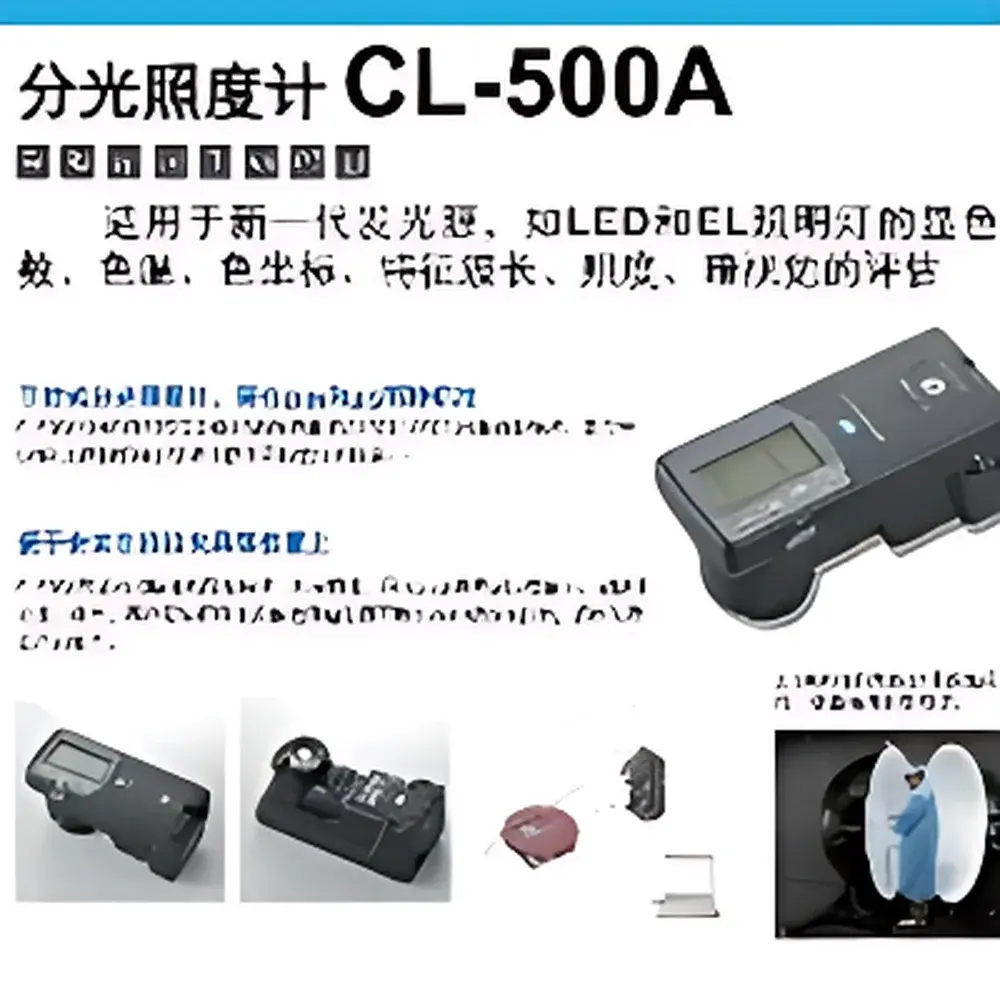
Konica Minolta CL-500A Series Handheld Spectrophotometric Illuminance Meter
| Brand | Konica Minolta |
|---|---|
| Origin | Japan |
| Model | CL-500A Series |
| Measurement Range | 0.1–99,990 lx (typical) |
| Spectral Resolution | 1 nm |
| Wavelength Range | 380–780 nm |
| Accuracy | ±2% (illuminance), ±0.002 (chromaticity) |
| Interface | USB 2.0 |
| Software Included | CL-S10w Data Management Software & Excel® Add-in |
| Multi-unit Control | Up to 10 units via CL-S10w |
Overview
The Konica Minolta CL-500A Series is a handheld spectrophotometric illuminance meter engineered for high-fidelity photometric and colorimetric characterization of light sources in laboratory, industrial, and field environments. Unlike conventional silicon photodiode-based lux meters, the CL-500A employs a diffraction grating spectrometer with a linear CCD sensor to acquire full spectral power distribution (SPD) data at 1 nm resolution across the visible spectrum (380–780 nm). This spectral acquisition enables traceable calculation of photometric quantities—including illuminance (lx), chromaticity coordinates (CIE 1931 x,y and u’v’), correlated color temperature (CCT), Duv, and color rendering indices (CRI Ra and R1–R15)—all compliant with CIE S 026/E:2018 and ISO/CIE 19476:2014 standards. Its compact form factor, battery-powered operation, and real-time spectral visualization make it suitable for validation of lighting installations, LED quality control, daylight harvesting system commissioning, and photobiological safety assessments per IEC 62471.
Key Features
- High-resolution spectral measurement: 1 nm spectral sampling interval over 380–780 nm, enabling precise peak wavelength identification and narrowband source analysis.
- Traceable photometric accuracy: Illuminance uncertainty ≤ ±2% (k=2) against NIST-traceable standards; chromaticity reproducibility ≤ ±0.002 Δx,Δy under stable conditions.
- Integrated spectral display: Real-time graphical rendering of SPD curves on device LCD; exportable as CSV or XML for third-party spectral modeling (e.g., Radiance, Dialux).
- Dual software architecture: CL-S10w (included) provides centralized control, multi-point logging, and report generation; Excel® Add-in enables direct data ingestion into spreadsheets for statistical analysis, tolerance banding, and SPC charting.
- Scalable multi-sensor deployment: CL-S10w supports synchronized acquisition from up to 10 CL-500A units—ideal for spatial uniformity mapping of luminaires or architectural lighting validation.
- Robust optical design: Cosine-corrected diffuser with f/2.5 entrance optics ensures <3% f1′ error per CIE 69:2008; temperature-stabilized sensor minimizes drift during extended field measurements.
Sample Compatibility & Compliance
The CL-500A accommodates continuous, pulsed, and modulated light sources—including incandescent, fluorescent, HID, OLED, and PWM-driven LEDs—with automatic integration time adjustment (10 ms–10 s). It meets the metrological requirements of ISO/CIE 19476:2014 for spectral irradiance measurement and complies with JIS Z 8722 for colorimetric evaluation. Data integrity adheres to GLP principles: CL-S10w implements user-access logs, electronic signatures (via Windows authentication), and audit-trail-enabled file history—supporting alignment with FDA 21 CFR Part 11 when deployed in regulated manufacturing environments. Calibration certificates include uncertainty budgets per ISO/IEC 17025:2017.
Software & Data Management
CL-S10w is a Windows-based application offering real-time spectral visualization, batch processing of multi-point datasets, and customizable report templates (PDF, HTML, XLSX). It supports automated pass/fail evaluation against user-defined limits for CCT, CRI, and illuminance uniformity. The Excel® Add-in registers as a COM object, enabling VBA scripting for automated data aggregation across production shifts or facility-wide surveys. Raw spectral data (301-channel intensity values) is stored in vendor-neutral ASCII format. An optional Software Development Kit (SDK) provides .NET and C++ APIs for integration into MES, SCADA, or custom QA dashboards—enabling programmable trigger logic, remote firmware updates, and cloud synchronization via RESTful endpoints.
Applications
- LED manufacturing: Bin sorting verification, phosphor consistency monitoring, and post-assembly CCT/CRI screening.
- Architectural lighting design: In-situ verification of spatial illuminance distribution, glare assessment (UGR), and daylight-responsive control calibration.
- Display backlight validation: Spectral fidelity checks for wide-gamut LCDs and microLED arrays.
- Photobiology research: Quantification of circadian-effective irradiance (EML, melanopic lux) per CIE TN 003:2015.
- Regulatory compliance testing: Verification against ENERGY STAR Lamps V2.1, DLC Premium v5.1, and EU Ecodesign Regulation (EU) 2019/2020.
FAQ
What spectral data formats does the CL-500A export?
Raw SPD data is exported as tab-delimited ASCII (.txt) with wavelength (nm) and relative intensity columns; CL-S10w also supports CSV, XML, and proprietary .clm formats.
Is factory recalibration required annually?
Yes—Konica Minolta recommends annual recalibration against NIST-traceable reference lamps; certificate includes expanded uncertainty reporting per ISO/IEC 17025.
Can the CL-500A measure pulsed or flickering light sources?
Yes—it automatically detects modulation frequency and adjusts integration time to capture full-cycle SPD without aliasing, supporting frequencies up to 1 kHz.
Does CL-S10w support networked database storage?
Native SQL Server or PostgreSQL connectivity is not included, but ODBC-compliant exports and SDK-driven middleware integration enable enterprise-level data warehousing.
How is cosine response error corrected?
The integrated diffuser follows CIE 69:2008 Class A tolerances; correction factors are applied in firmware using pre-characterized angular sensitivity maps stored in non-volatile memory.


