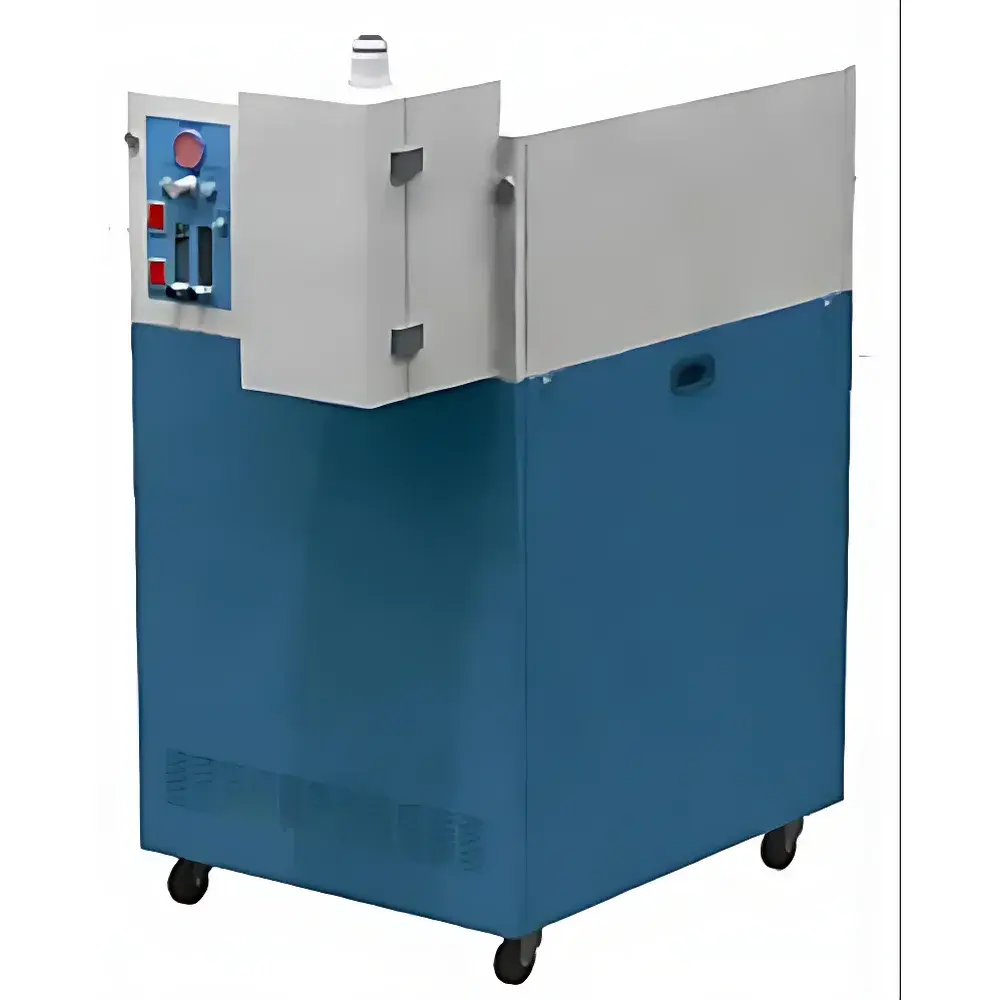
MFS-12 Spark Emission Spectrometer
| Origin | Imported |
|---|---|
| Manufacturer Type | Authorized Distributor |
| Model | MFS-12 |
| Quotation | Upon Request |
| Focal Length | 500 mm |
| Spectral Range | 190–425 nm |
| Detector | 10 linear CCD arrays, 3648 pixels each |
| Sample Stage | Universal design for solid metals, rods, wires, and pressed powders (e.g., ores, oxides, ferroalloys, slags) |
| Excitation Source | Computer-controlled low-voltage spark generator |
| Plasma Current | 25–350 A |
| Discharge Duration | 30–600 µs |
| Repetition Frequency | 50–400 Hz |
| Detection Limit | 0.001 wt% |
| Concentration Range | 0.001% to tens of % |
| Relative Standard Deviation | 0.5–5% (concentration-dependent) |
| Analysis Time | 10–40 s per sample |
| Operating Temperature | 15–25 °C |
| Relative Humidity | ≤80% (non-condensing) |
| Power Supply | 220 V ±10%, 50 Hz, single-phase with earth grounding |
| Max. Power Consumption | 2.5 kVA |
| Dimensions (W×H×D) | 834 × 995 × 520 mm |
| Weight | 110 kg |
Overview
The MFS-12 Spark Emission Spectrometer is a high-performance, benchtop optical emission spectrometer (OES) engineered for precise elemental analysis of conductive metallic materials and pressed powder samples. Based on the Paschen-Runge optical layout, it employs a fixed 500 mm focal length Czerny-Turner monochromator architecture with thermally stable cast-iron optical bench construction—ensuring long-term wavelength calibration integrity and minimal drift under laboratory conditions. Unlike sequential PMT-based systems, the MFS-12 utilizes ten synchronized linear CCD arrays (3648 pixels each), providing full-spectrum coverage from 190 nm to 425 nm without blind zones or mechanical scanning. This multi-channel detection enables simultaneous acquisition of all analytical lines, delivering high reproducibility and robustness for routine quality control in foundries, metallurgical labs, and incoming material inspection environments.
Key Features
- Paschen-Runge optical design with 500 mm focal length and rigid cast-iron optical platform for superior spectral stability and mechanical rigidity
- Full-spectrum CCD detection: 10 linear CCD arrays (3648 pixels each) enabling simultaneous measurement across 190–425 nm with no moving parts
- Universal sample interface accommodating irregular solids (rods, wires), machined discs, and pressed powder pellets (e.g., iron ore, slag, ferroalloys)
- Microprocessor-controlled low-voltage spark source with fully adjustable plasma current (25–350 A), discharge duration (30–600 µs), and repetition frequency (50–400 Hz) for optimized excitation of diverse matrices
- Integrated closed-loop water cooling system eliminating thermal drift in detector and optics—no external chiller required
- USB 2.0 high-speed data interface supporting real-time transfer of up to 40,000 spectral data points per acquisition
- Compact footprint (834 × 995 × 520 mm) and self-contained operation—no argon purge or vacuum pump needed
Sample Compatibility & Compliance
The MFS-12 is validated for direct analysis of electrically conductive samples including carbon steels, stainless steels, aluminum alloys, copper alloys, titanium, and nickel-based superalloys. Non-conductive powders (e.g., MnO₂, Fe₂O₃, CaF₂, blast furnace slag) are analyzed using graphite or copper binder pelletization protocols compliant with ASTM E1086 and ISO 11577. The instrument meets IEC 61000-6-3 (EMC emissions) and IEC 61010-1 (safety requirements for electrical equipment for measurement). Its optical path design avoids ozone-generating UV wavelengths below 190 nm, eliminating the need for forced ventilation or exhaust ducting. While not certified to FDA 21 CFR Part 11 out-of-the-box, audit trails, user access controls, and electronic signature support can be implemented via WinCCD configuration for GLP/GMP-aligned workflows.
Software & Data Management
Controlled via Windows-based WinCCD software, the MFS-12 provides intuitive instrument setup, spectral acquisition, calibration management, and quantitative analysis without specialized operator training. WinCCD supports multi-point calibration curves (intensity vs. concentration), matrix-matched standardization, inter-element correction (IEC), and limit-of-detection (LOD) calculation per element. All raw spectra are stored in vendor-neutral .csv and .spc formats. The software includes built-in tools for spectral overlay, peak identification, background subtraction, and line selection optimization. Data export complies with LIMS integration standards (ODBC, ASCII, XML), and optional modules enable automated report generation aligned with ISO/IEC 17025 documentation requirements.
Applications
- Routine grade identification and alloy verification in metal production and recycling facilities
- Trace element monitoring (e.g., S, P, B, Sn, As) in high-purity steel and aerospace-grade aluminum
- Quantitative analysis of major, minor, and trace constituents in ferroalloys (e.g., Fe-Mn, Fe-Si, Fe-Cr)
- Process control of raw materials including iron ore fines, limestone fluxes, and synthetic slags
- Research applications requiring rapid spectral survey scans for unknown sample screening
- Compliance testing against ASTM E415 (steel), ASTM E1086 (stainless), and EN 10316 (aluminum alloys)
FAQ
Does the MFS-12 require argon purging or vacuum operation?
No. The sealed optical chamber and spectral range (190–425 nm) eliminate the need for inert gas flushing or vacuum pumping.
Can the MFS-12 analyze non-conductive samples such as ceramics or polymers?
Not directly. Only conductive solids or pressed powder pellets with conductive binders (e.g., graphite, copper) are compatible.
What is the typical recalibration interval under continuous use?
With stable ambient conditions (±1 °C/hour), recalibration is recommended every 8–12 hours or after 50–100 samples—verified via control sample checks.
Is WinCCD compatible with Windows 10/11 64-bit operating systems?
Yes. WinCCD v4.2 and later support Windows 10 and 11 (64-bit), including driver signing compliance and UAC-aware installation.
How is measurement uncertainty reported in WinCCD?
Uncertainty is calculated per element using the relative standard deviation (RSD) of calibration replicates and propagated through the calibration curve; values are displayed alongside results and exported in reports.