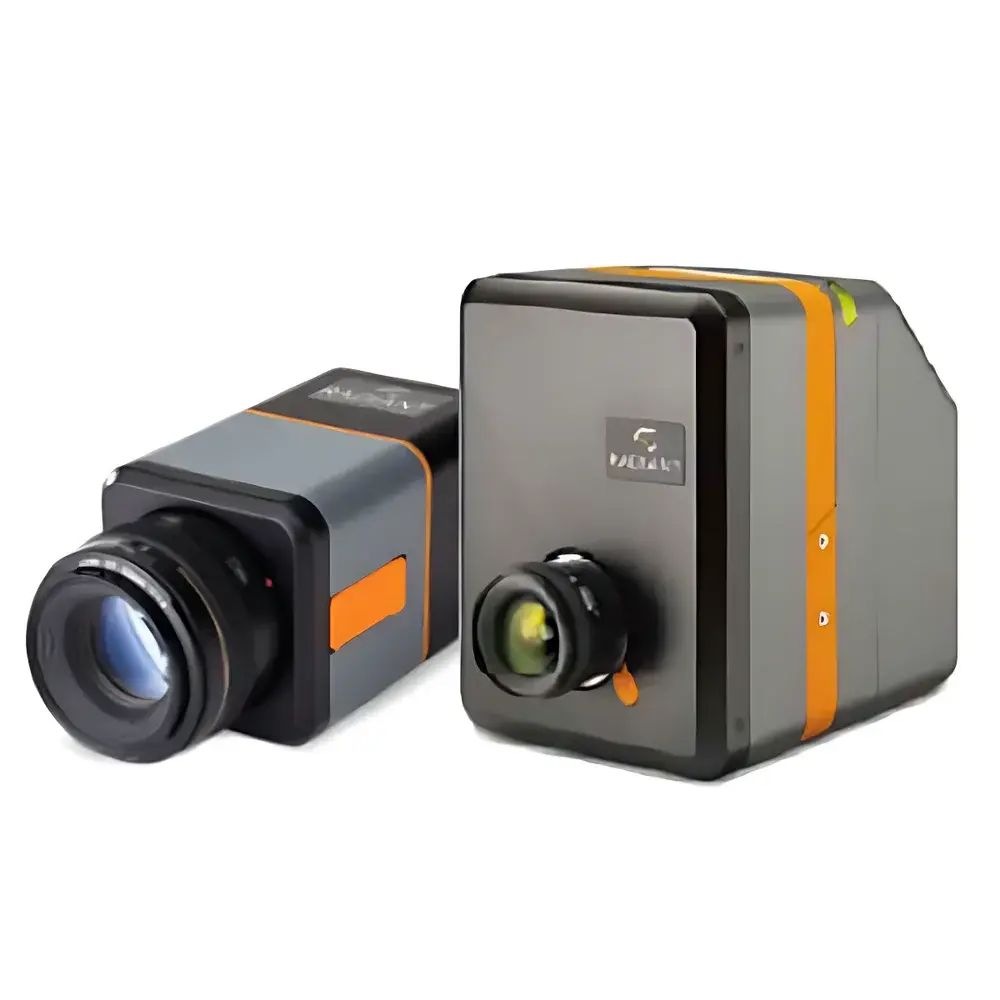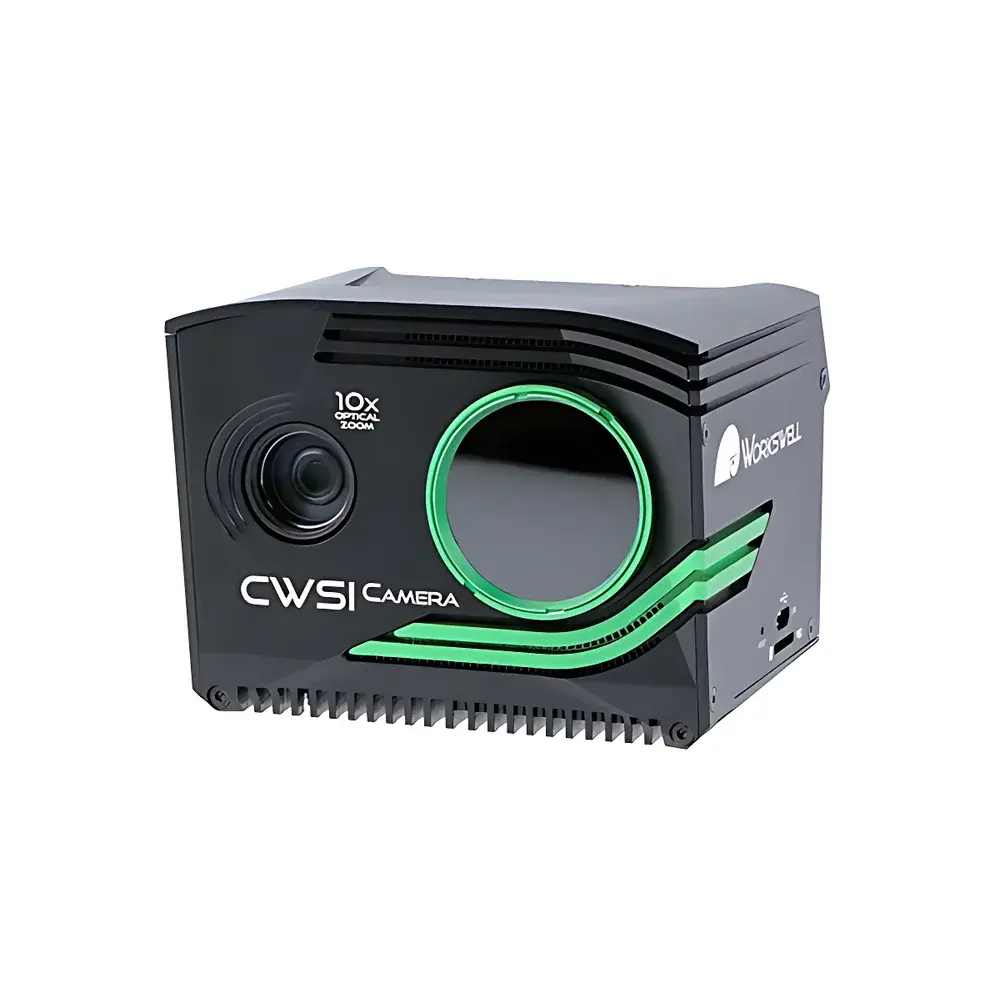
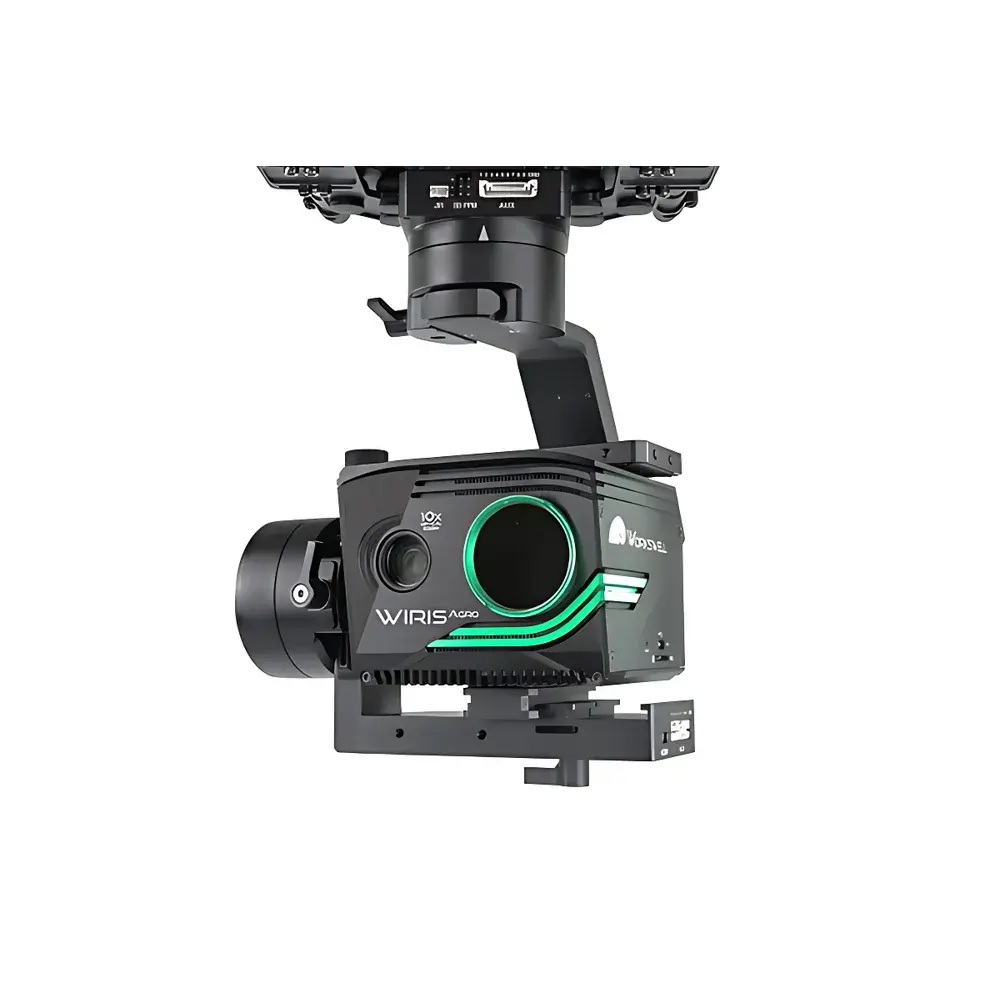
Workswell CWSI Crop Water Stress Index Thermal Imaging Camera
| Brand | Workswell |
|---|---|
| Origin | Czech Republic |
| Model | CWSI |
| Thermal Resolution | 640 × 512 pixels |
| Spectral Range | LWIR (Long-Wave Infrared) |
| Thermal Sensitivity (NETD) | 0.03 °C (30 mK) |
| Temperature Range | −10 °C to +55 °C |
| Accuracy | ±0.03 °C |
| Frame Rate | Full HD (1920 × 1080) RGB video synchronized with thermal data |
| Optical Zoom | 10× stabilized |
| Field of View | 45° (wide) to 6.9° (telephoto) |
| Visible Light Camera Resolution | 1920 × 1080 pixels (FHD), auto white balance, WDR, backlight compensation, gamma control |
| Digital Zoom | 1–14× continuous |
| Focus | Autofocus with zoom synchronization |
| Image Storage | Internal 128 GB SSD + USB/SD card expansion |
| GPS Integration | External GPS support with geotagging |
| Connectivity | Wi-Fi (low-latency streaming), Ethernet (RJ-45), S.Bus/CAN bus (DJI M600/A3 compatible), MAVLink, external trigger |
| Power Input | 9–36 V DC |
| Power Consumption | 12 W |
| Dimensions | 83 × 85 × 68 mm |
| Weight | < 430 g |
| Operating Temperature | −10 °C to +55 °C |
| Storage Temperature | −30 °C to +60 °C |
| Compliance | CE, RoHS, EN 61000-6-3/-4 |
Overview
The Workswell CWSI Crop Water Stress Index Thermal Imaging Camera is a purpose-built, field-deployable infrared imaging system engineered for quantitative plant physiological monitoring in precision agriculture. Unlike conventional vegetation indices derived from reflectance spectroscopy (e.g., NDVI), the CWSI camera operates on the biophysical principle that plant transpiration rate—and thus leaf temperature—is directly modulated by stomatal conductance under water-limited conditions. By capturing high-fidelity long-wave infrared (LWIR) radiance in the 7.5–13.5 µm spectral band and co-registering it with full-HD visible-light imagery, the system computes pixel-wise Crop Water Stress Index (CWSI) values in real time or post-processing. This index, grounded in the theoretical framework of the “non-water-stressed baseline” (NWSB) and empirical upper/lower baselines, provides a dimensionless, normalized metric ranging from 0 (no stress) to 1 (severe stress), enabling spatially explicit mapping of crop water status across heterogeneous fields. The device is not a generic thermal imager but a calibrated, agricultural-grade instrument designed for reproducible, physics-based stress quantification—making it suitable for regulatory-compliant irrigation audits, drought impact assessment, and phenotypic trait extraction in breeding trials.
Key Features
- Integrated dual-sensor architecture: Uncooled microbolometer FPA (640 × 512 pixels) with NETD ≤ 30 mK, paired with a stabilized 10× optical zoom RGB camera (1920 × 1080 resolution) for precise spatial registration.
- Real-time and offline CWSI computation: Onboard processing supports live CWSI visualization; raw thermal and visible data are preserved for traceable reprocessing using standardized algorithms per ASABE EP432.3 and FAO-56 guidelines.
- Robust environmental operation: Rated for −10 °C to +55 °C ambient operation with active thermal stabilization; sealed housing compliant with IP54 ingress protection for field deployment on UAVs or ground vehicles.
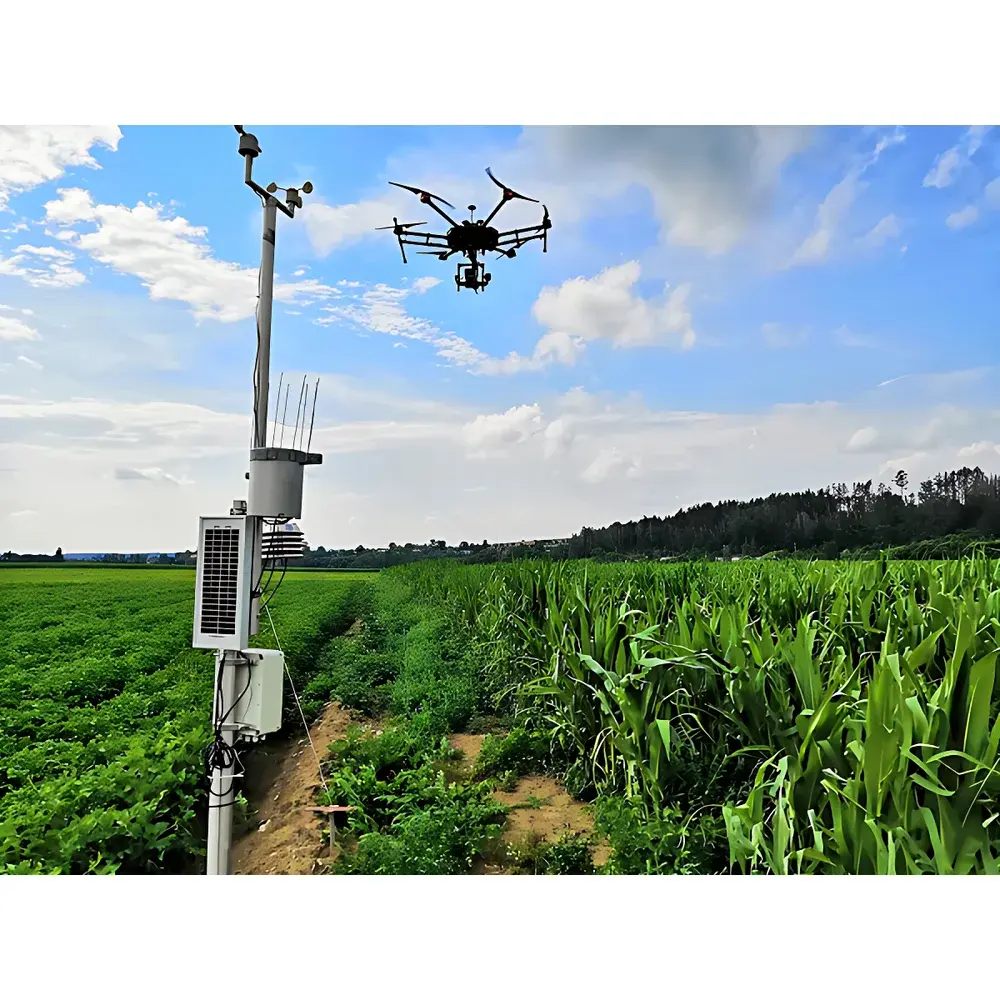
- Multi-interface ecosystem: Native compatibility with DJI A3/M600 platforms via S.Bus/CAN, MAVLink telemetry integration, Ethernet-based remote configuration, and low-latency Wi-Fi streaming for mission control.
- Geospatial data integrity: External GPS synchronization enables centimeter-level georeferencing of each CWSI frame when used with RTK-GNSS receivers; metadata (timestamp, GPS coordinates, sensor orientation) embedded in EXIF and sidecar files.
- Scalable data handling: Internal 128 GB SSD supports >10 hours of synchronized thermal/RGB video at full resolution; batch processing of hundreds of images supported via CWSI Analyzer software with automated baseline fitting and outlier rejection.
Sample Compatibility & Compliance
The CWSI camera is validated for use across major agronomic species—including maize, wheat, soybean, potato, vineyard, and orchard crops—under both rainfed and irrigated management systems. Its measurement methodology aligns with internationally accepted frameworks for plant water status evaluation, including ISO 11274 (soil–plant–atmosphere continuum modeling), ASABE Standard EP432.3 (thermal-based crop water stress assessment), and FAO Irrigation and Drainage Paper No. 56 (crop coefficient and evapotranspiration estimation). While not a medical or safety-critical device, the system conforms to EU electromagnetic compatibility (EN 61000-6-3/-4) and radio equipment directives (RED 2014/53/EU). All firmware and software comply with GDPR data handling requirements; no cloud upload occurs without explicit user consent. For GLP/GMP-aligned trials, audit trails, calibration logs, and version-controlled processing scripts are exportable from CWSI Analyzer.
Software & Data Management
CWSI Analyzer is a desktop application (Windows 10/11, 64-bit) designed for scientific reproducibility. It implements peer-reviewed CWSI calculation protocols—including both empirical and theoretical baseline methods—and allows users to define crop-specific parameters (e.g., canopy height, LAI, aerodynamic resistance) for refined stress interpretation. The software supports batch processing with customizable ROI masking, temporal stacking, and change-detection workflows across multi-season datasets. Export formats include GeoTIFF (with embedded projection and geotags), CSV (pixel-level CWSI + metadata), and PDF reports compliant with ISO/IEC 17025 documentation standards. All processing steps—including baseline selection, emissivity correction (default ε = 0.98 ± 0.01), and atmospheric transmission compensation—are logged with timestamps and user IDs. Optional FDA 21 CFR Part 11 compliance mode enables electronic signatures, role-based access control, and immutable audit trails for regulated agricultural research.
Applications
- Irrigation optimization: Spatial identification of over- and under-irrigated zones enables dynamic adjustment of drip/sprinkler scheduling and soil moisture sensor placement—reducing water use by up to 22% while maintaining yield, as demonstrated in EU H2020 AgriDrone trials.
- Drought phenotyping: High-throughput screening of germplasm under controlled deficit irrigation, correlating CWSI dynamics with root architecture traits (e.g., deep rooting index) and yield stability metrics.
- Yield forecasting: Integration of time-series CWSI maps with weather station data and soil hydraulic models improves seasonal yield prediction accuracy by >15% compared to NDVI-only models (validated in Czech Academy of Sciences field trials, 2022–2023).
- Regulatory reporting: Generation of auditable CWSI maps for water licensing applications, drought mitigation subsidy claims, and sustainability certification (e.g., SAI Platform Farm Sustainability Assessment).
- Climate resilience monitoring: Long-term tracking of interannual CWSI variability across agroecological zones to inform regional adaptation strategies and insurance risk modeling.
FAQ
What distinguishes CWSI from NDVI in practical agricultural monitoring?
CWSI is a physiological indicator derived from canopy temperature differentials under vapor pressure deficit conditions, directly reflecting stomatal response to water availability. NDVI measures chlorophyll-related reflectance and detects structural or photosynthetic changes—often lagging behind actual water stress onset by several days. CWSI thus provides earlier, mechanistically grounded intervention signals.
Can CWSI be used on cloudy or humid days?
Yes, but with protocol adjustments. High humidity reduces vapor pressure deficit (VPD), compressing the CWSI dynamic range. The CWSI Analyzer includes VPD normalization tools and supports conditional baseline recalibration based on concurrent meteorological inputs.
Is radiometric calibration traceable to national standards?
Yes. Each unit ships with a NIST-traceable calibration certificate covering the full operating temperature range (−10 °C to +55 °C), verified annually against blackbody sources certified to ISO/IEC 17025 standards.
Does the system support integration with farm management information systems (FMIS)?
Yes. CWSI Analyzer exports OGC-compliant GeoJSON and GeoTIFF layers compatible with major FMIS platforms (e.g., Granular, Climate FieldView, AgLeader SMS) via standard GDAL drivers and REST API hooks.
What is the recommended flight altitude for UAV-based CWSI surveys?
For 10 cm/pixel GSD on row crops, optimal altitude is 60–90 m AGL. The 10× stabilized zoom and 45° wide FOV enable flexible platform selection—from DJI M300 RTK to fixed-wing VTOL systems—without compromising thermal sampling density.