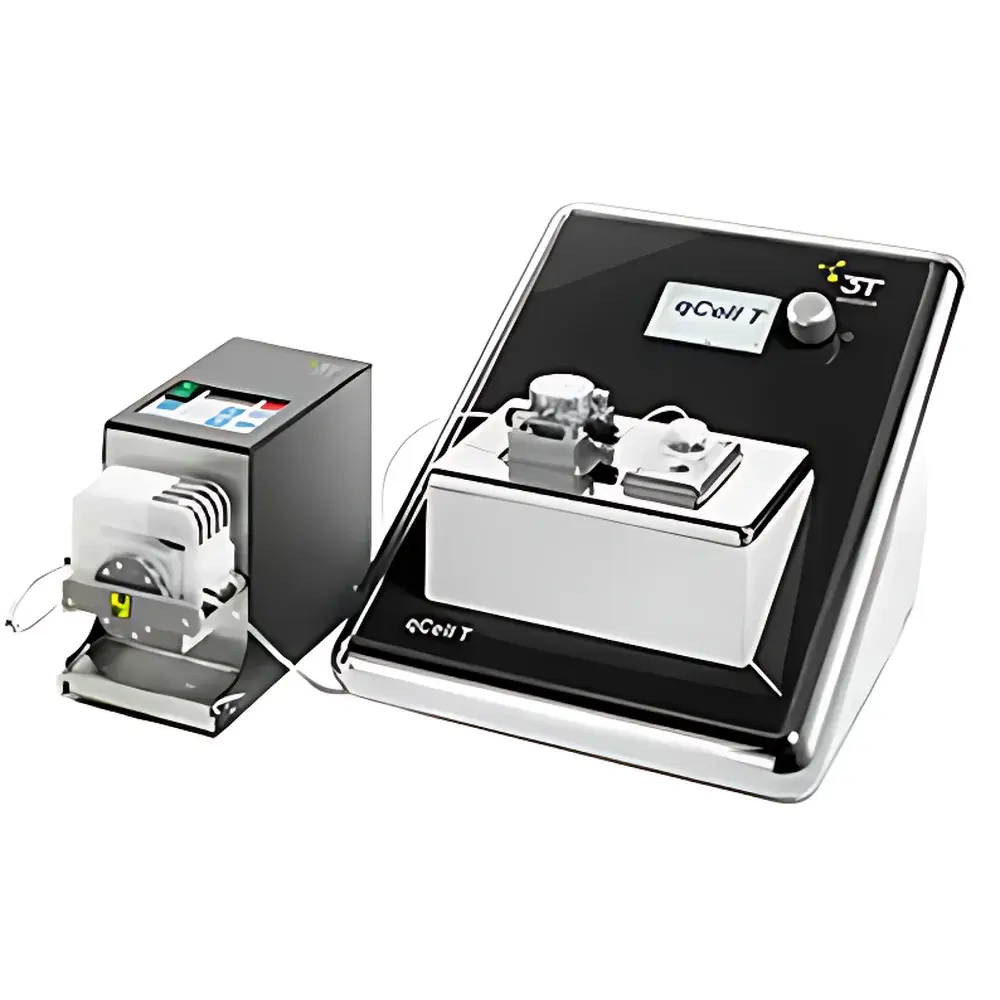
3T analytik QCM-D qCell T Quartz Crystal Microbalance with Dissipation Monitoring
| Brand | 3T analytik |
|---|---|
| Origin | Germany |
| Model | qCell T |
| Measurement Principle | Piezoelectric Resonance (5–25 MHz fundamental frequency) with Dual-Parameter Tracking (Frequency Δf and Energy Dissipation ΔD) |
| Temperature Control | Peltier-based, ±0.1 °C stability |
| Fluid Handling | Integrated peristaltic pump (flow rate adjustable 0.01–2.0 mL/min) |
| Data Acquisition | Real-time, up to 100 Hz sampling rate |
| Chip Compatibility | Standard 5 MHz AT-cut quartz sensors (Ø 14 mm), gold-coated or custom electrode configurations |
| Software | qGraph v5.x (Windows-based, audit-trail enabled, FDA 21 CFR Part 11 compliant modules available) |
| Compliance | CE-marked, ISO 9001 certified manufacturing, GLP-ready architecture |
Overview
The 3T analytik qCell T is a high-precision, single-channel Quartz Crystal Microbalance with Dissipation monitoring (QCM-D) system engineered for label-free, real-time analysis of interfacial phenomena at solid–liquid and solid–gas boundaries. Based on the piezoelectric resonance principle, the instrument measures simultaneous shifts in resonant frequency (Δf, proportional to mass change via Sauerbrey relation) and energy dissipation (ΔD, indicative of viscoelasticity and structural softness of adsorbed layers). Unlike conventional QCM systems that report only frequency, the qCell T’s dual-parameter acquisition enables quantitative differentiation between rigidly bound monolayers and hydrated, dissipative films—such as hydrogels, lipid bilayers, or cellular membranes—thereby delivering physicochemically meaningful data beyond nominal mass uptake. Designed and manufactured in Tuttlingen, Germany, the system integrates a thermally stabilized measurement chamber, precision fluidics, and industry-grade sensor electronics to ensure long-term baseline stability (<0.5 Hz drift over 24 h) and sub-nanogram mass resolution under controlled environmental conditions.
Key Features
- Real-time dual-parameter detection: Simultaneous tracking of frequency shift (Δf, in Hz) and dissipation factor (ΔD, dimensionless ×10−6) across multiple overtones (typically 3rd to 7th)
- Peltier temperature control module: Maintains sample chamber temperature from 4 °C to 45 °C with ±0.1 °C accuracy and <0.02 °C/h drift, critical for kinetic studies and thermodynamic profiling
- Integrated peristaltic pump: Programmable flow rates (0.01–2.0 mL/min), low-pulsation delivery, chemically resistant tubing compatible with aqueous buffers, organic solvents, and surfactant solutions
- Modular sensor chamber design: Supports standard 14 mm diameter AT-cut quartz crystals; optional multi-electrode chips and functionalized surfaces (e.g., COOH-, NH2-, biotin-, or streptavidin-coated) for tailored surface chemistry
- Hardware-level synchronization: All analog and digital signals timestamped with microsecond precision, enabling correlation with external instrumentation (e.g., SPR, ellipsometry, or fluorescence readers)
Sample Compatibility & Compliance
The qCell T accommodates a broad range of sample types—including proteins, peptides, nucleic acids, polymers, liposomes, whole cells, bacterial suspensions, and colloidal nanoparticles—without labeling or amplification. Its fluidic path is compatible with common laboratory reagents (PBS, HEPES, Tris, ethanol, DMSO ≤10% v/v) and supports continuous flow, stopped-flow, and injection-based protocols. The system conforms to CE marking requirements under the EU Machinery Directive 2006/42/EC and Electromagnetic Compatibility Directive 2014/30/EU. Manufacturing adheres to ISO 9001:2015 quality management standards. For regulated environments, optional qGraph software modules provide electronic signatures, user access controls, and full audit trails compliant with FDA 21 CFR Part 11 and EU Annex 11 guidelines. Instrument validation documentation (IQ/OQ/PQ templates) is supplied for GLP and GMP-aligned laboratories.
Software & Data Management
qGraph v5.x serves as the native control and analysis platform, offering intuitive experiment setup, live visualization of Δf/ΔD time traces, and advanced post-processing tools. Users define temperature ramps, flow sequences, and sensor equilibration steps via graphical workflow editors. Raw data are stored in vendor-neutral HDF5 format, ensuring long-term archival integrity and third-party interoperability (e.g., with Python-based analysis pipelines or MATLAB). Built-in fitting algorithms support Voigt-based viscoelastic modeling, Sauerbrey and Kanazawa corrections, and layer-by-layer thickness estimation using acoustic coupling theory. Data export options include CSV, Excel, and PDF reporting with customizable metadata embedding (operator ID, timestamp, protocol version, calibration history).
Applications
- Molecular interaction kinetics: Quantification of binding affinity (KD), association/dissociation rates (kon/koff), and stoichiometry for protein–ligand, antibody–antigen, and receptor–drug systems
- Biofilm formation and disruption: Real-time monitoring of bacterial adhesion, extracellular polymeric substance (EPS) secretion, and antimicrobial agent efficacy
- Cell adhesion and mechanobiology: Label-free assessment of integrin-mediated attachment, spreading dynamics, and cytoskeletal remodeling on biomaterial surfaces
- Polymers and soft matter: Characterization of polyelectrolyte multilayer (PEM) assembly, hydrogel swelling/collapse transitions, and nanoparticle–membrane interactions
- Hemocompatibility testing: Dynamic evaluation of platelet adhesion, fibrin network development, and coagulation cascade activation on medical device coatings
- Environmental interface science: Adsorption/desorption behavior of micropollutants, humic substances, or microplastics onto filtration membranes or soil analogues
FAQ
What is the difference between QCM and QCM-D?
QCM measures only frequency shift (Δf), assuming rigid, thin-film adsorption. QCM-D adds dissipation monitoring (ΔD), enabling distinction between rigid and soft, hydrated layers—essential for biological and polymeric systems.
Can the qCell T operate in air or only in liquid?
It supports both liquid-phase (aqueous/organic solvents) and gas-phase measurements, though dissipation quantification is most robust in viscous media where energy loss mechanisms are pronounced.
Is sensor regeneration possible after an experiment?
Yes—gold-coated sensors can be regenerated using UV-ozone treatment, piranha solution (with caution), or gentle plasma cleaning; surface functionalization may require re-coating depending on chemistry.
Does the system support multi-frequency overtone analysis?
Yes—standard operation includes real-time monitoring of up to seven overtones (3rd through 15th), allowing thickness and density profiling via overtone-dependent dispersion analysis.
How is temperature uniformity ensured across the sensor surface?
A symmetric Peltier element array coupled with thermal shielding and embedded Pt100 sensors ensures radial temperature homogeneity within ±0.05 °C across the active quartz area.