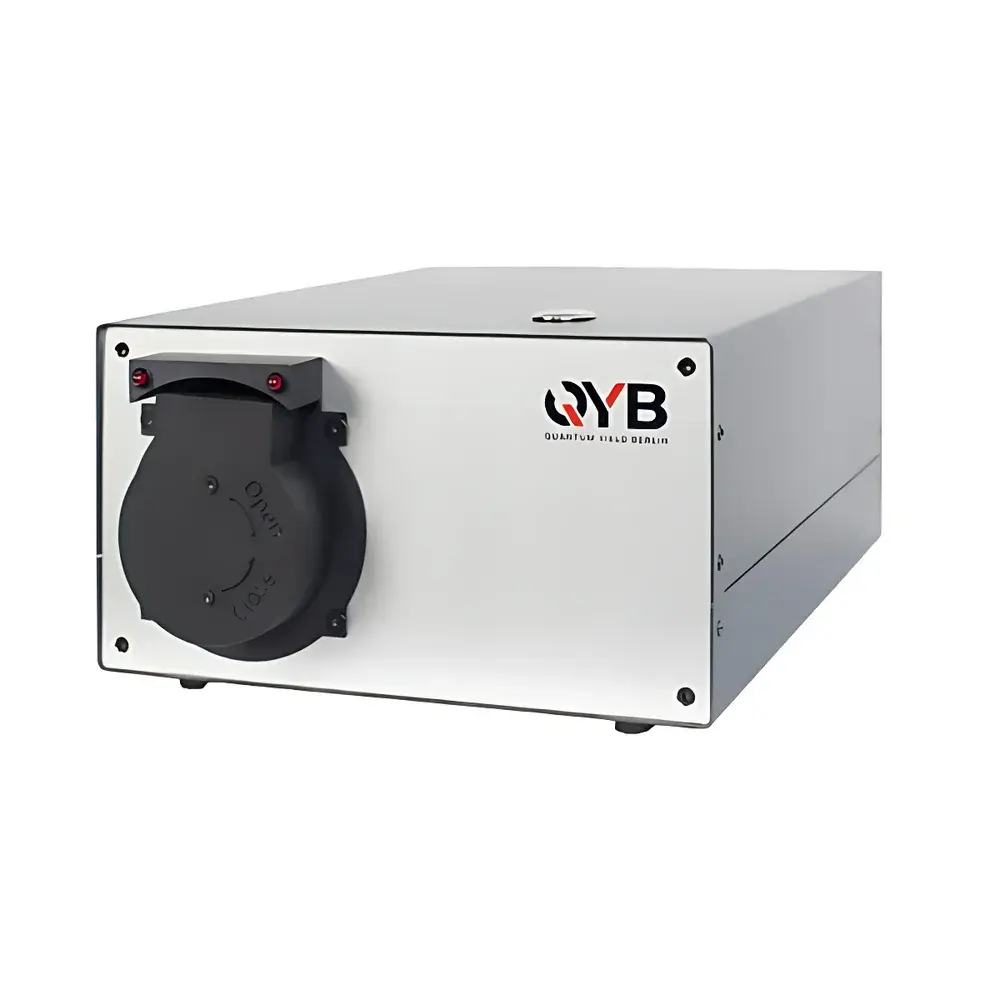
QYB LuQY Pro Absolute Photoluminescence Quantum Yield Measurement System
| Brand | QYB / Quantum Yield Berlin |
|---|---|
| Origin | Germany |
| Manufacturer Type | Authorized Distributor |
| Origin Category | Imported |
| Model | LuQY Pro |
| Price Range | USD 27,000 – 68,000 (FOB Hamburg) |
| Measurement Mode | DC Excitation |
| Excitation Wavelength | 520 nm |
| Laser Power Range | 7 µW – 70 mW |
| Photon Flux Equivalent Current | 1.8 µA – 18 mA |
| Adjustable Spot Size (Optional) | 0.5 cm² |
| Spectral Range | 550 – 1000 nm |
| Minimum Detectable PLQY | ≥1×10⁻⁵ |
| Integration Time | 1 ms – 35 min |
| Spectral Sampling Interval | 1 nm |
| Signal-to-Noise Ratio | 600:1 |
| Sample Holder | Customizable (Max. 30 mm × 30 mm × 10 mm) |
| Dimensions | 220 mm × 300 mm × 120 mm |
| Weight | 5.2 kg |
| Calibration Traceability | Fraunhofer ISE CalLab PV Cells (photon flux), NIST-traceable broadband lamp (spectral responsivity) |
Overview
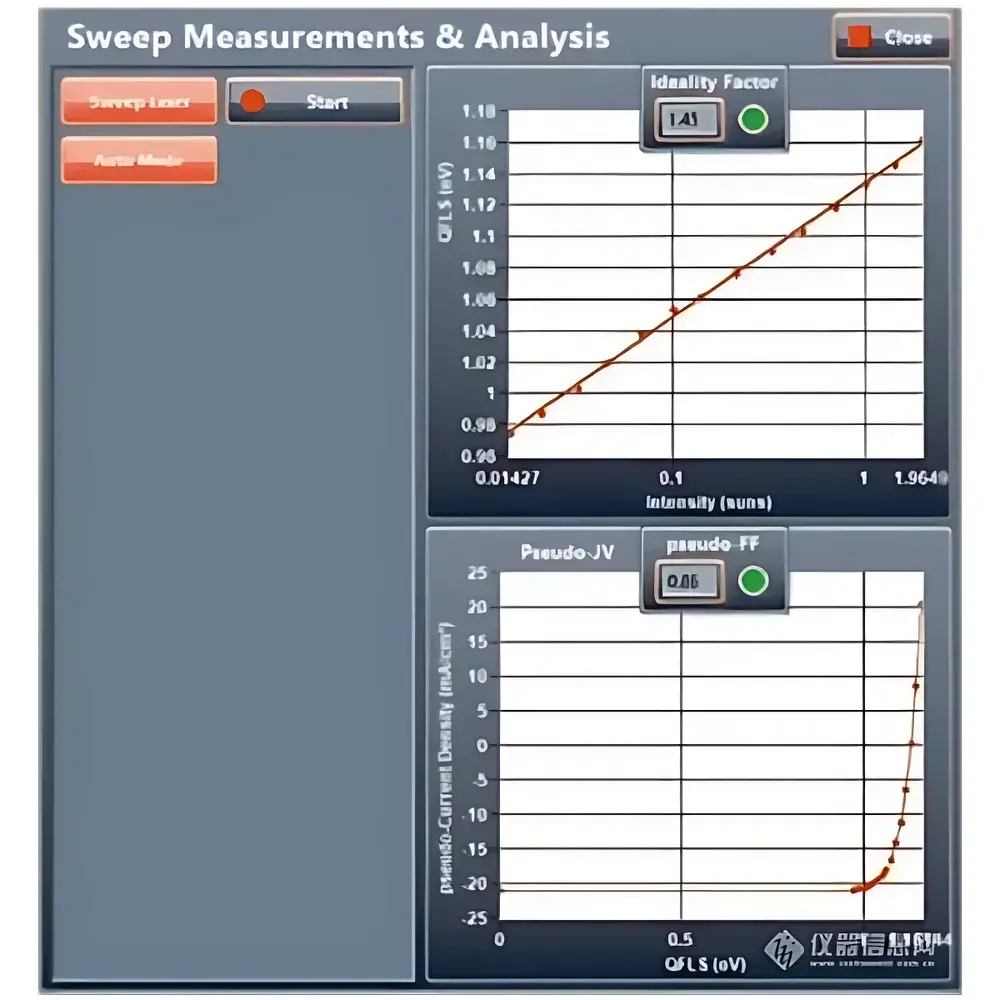
The QYB LuQY Pro Absolute Photoluminescence Quantum Yield Measurement System is an engineered solution for quantitative optoelectronic characterization of emerging photovoltaic and light-emitting materials—particularly perovskite absorbers, perovskite/silicon tandem cells, organic-inorganic hybrids, and near-infrared LEDs. It operates on the principle of absolute photon-counting photoluminescence (PL) spectroscopy under calibrated DC laser excitation. Unlike integrating sphere-based relative methods, the LuQY Pro delivers traceable, absolute PL quantum yield (PLQY) values by directly measuring both incident photon flux and emitted photon flux with NIST-traceable spectral responsivity and Fraunhofer ISE–certified reference cell calibration. This enables rigorous thermodynamic analysis—including quasi-Fermi level splitting (QFLS), radiative voltage loss (ΔVrad), ideality factor (n), and pseudo-JSC–VOC curve reconstruction—without reliance on external optical models or assumptions about absorption profiles.
Key Features
- Direct absolute PLQY determination with detection limit ≤1×10⁻⁵, validated against certified reference solar cells and NIST-traceable broadband sources
- Integrated 520 nm diode laser with continuously adjustable power (7 µW–70 mW), enabling precise control of excitation intensity from 0.002 to 2 “suns” (equivalent photon flux)
- Dual-axis laser positioning system for spatially resolved PL mapping across heterogeneous films and device stacks
- Simultaneous acquisition of excitation-corrected emission spectra (550–1000 nm, 1 nm sampling) and real-time PLQY/QFLS computation
- Two-tier QFLS calculation architecture: robust default method for broad-gap emitters; refined method requiring user-supplied EQE or absorption data for narrow-gap or low-Stokes-shift systems
- Compact footprint (220 × 300 × 120 mm) and glovebox-compatible design (O₂/H₂O < 0.1 ppm) for in-situ characterization of air-sensitive perovskites
- Automated excitation sweep protocols with synchronized spectral integration, supporting kinetic PL studies and intensity-dependent recombination analysis
Sample Compatibility & Compliance
The LuQY Pro accommodates planar thin-film samples up to 30 mm × 30 mm × 10 mm, including spin-coated, blade-coated, and vacuum-deposited perovskite layers; evaporated organic semiconductors; colloidal quantum dot films; and monolithic tandem subcells. Its optical path is optimized for low-absorption, high-refractive-index materials common in halide perovskites (n ≈ 2.5). All calibration procedures comply with ISO/IEC 17025:2017 requirements for testing laboratories. Spectral data output adheres to ASTM E2924–22 (Standard Practice for Reporting Photovoltaic Spectral Response Measurements) and supports traceable reporting for GLP-compliant R&D environments. Device firmware includes audit trail logging per FDA 21 CFR Part 11 requirements when operated with validated enterprise software configurations.
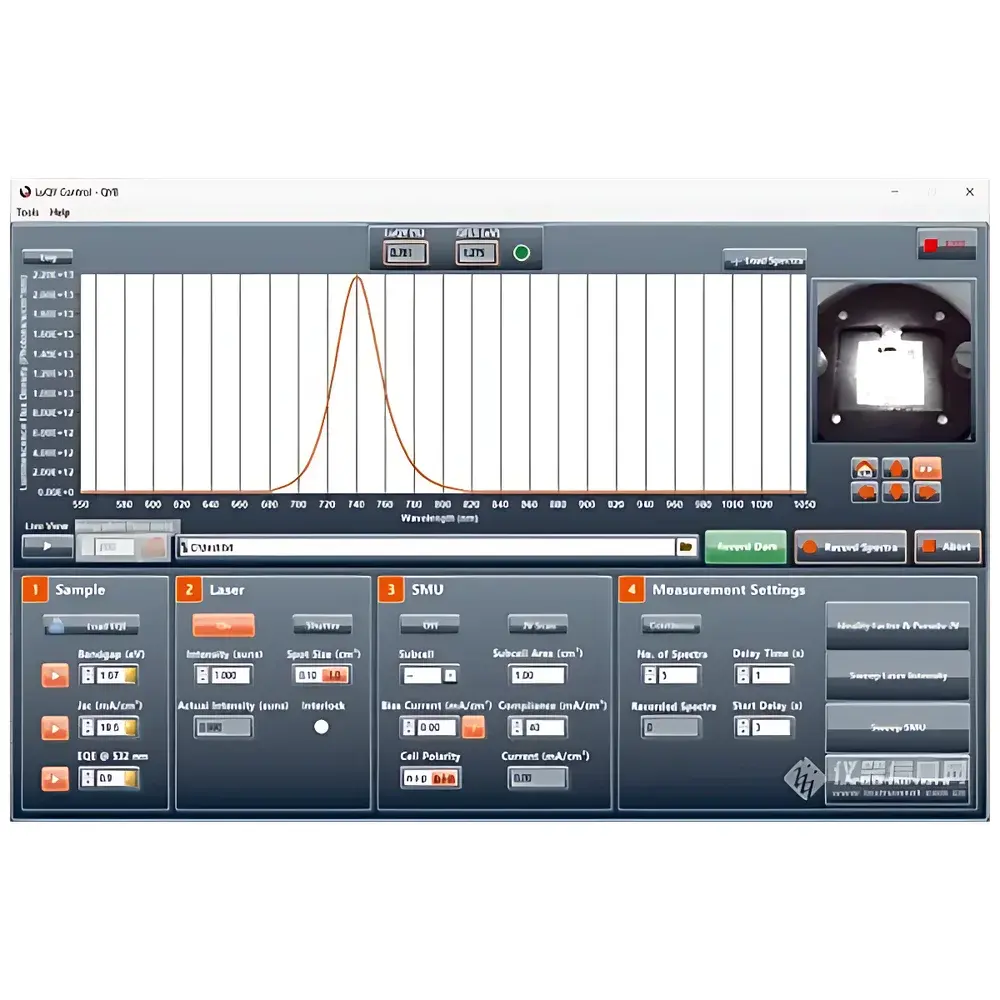
Software & Data Management
The LuQY Control Suite provides a dual-pane GUI: the upper panel displays live emission spectra, camera field-of-view preview, and dynamically updated PLQY and QFLS values; the lower panel manages sample metadata, excitation parameters (intensity, spot position, integration time), and spectral acquisition settings. The software implements two orthogonal QFLS algorithms—based on either empirical emission line shape analysis or absorption-corrected detailed-balance modeling—and automatically selects the higher-confidence method based on input data completeness and spectral characteristics. Export formats include CSV (full spectral traces), HDF5 (metadata-rich binary), and JSON-LD (semantic annotation compatible with FAIR data principles). Raw data files embed calibration certificates, timestamped environmental logs (if connected to glovebox sensors), and version-stamped instrument configuration hashes.
Applications
- Quantitative assessment of non-radiative recombination losses in wide- and narrow-bandgap perovskites (e.g., 1.68–1.92 eV absorbers for tandems)
- Correlation of PLQY and QFLS with VOC deficit and ideality factor in inverted and n-i-p device architectures
- Optimization of interfacial passivation layers (e.g., SAMs, 2D capping, metal oxides) via intensity-dependent PL kinetics
- Validation of EQE-derived JSC predictions through pseudo-JV curve generation under calibrated laser illumination
- Stability benchmarking: time-resolved PLQY tracking under controlled thermal, bias, or illumination stress conditions
- Material screening for NIR-emitting perovskites (750–1000 nm) targeting photonic upconversion or luminescent solar concentrators
FAQ
How is absolute photon flux calibrated in the LuQY Pro?
Calibration uses two independent traceable standards: (1) Fraunhofer ISE CalLab PV Cells for absolute photon number at 520 nm, and (2) a NIST-traceable tungsten-halogen lamp with known spectral radiant flux for spectrometer responsivity correction across 550–1000 nm.
Can the system measure PLQY under variable temperature or bias?
Yes—the base unit supports integration with third-party cryostats (4–300 K) and potentiostats (±10 V, 100 mA) via TTL-triggered synchronization and analog I/O ports for external parameter logging.
Is absorption data mandatory for QFLS calculation?
No. A default QFLS method operates without absorption input, but its uncertainty increases for low-bandgap emitters (<1.55 eV) or systems with small Stokes shifts (<50 meV). Providing EQE or absorption spectra reduces QFLS uncertainty by up to 3×.
What spectral resolution is achieved across the 550–1000 nm range?
The system achieves ≤1.2 nm full-width-at-half-maximum (FWHM) resolution at 600 nm, degrading to ≤2.1 nm at 950 nm, as verified with Hg-Ne and NIST SRM 2035 line sources.
Does the software support batch processing of multiple samples?
Yes—scriptable workflows (Python API) enable automated PLQY/QFLS extraction, outlier rejection, and statistical reporting across sample libraries, with configurable pass/fail thresholds aligned to internal QC protocols.
Related Products