3nh NQ-10-100A ISO 12233 Resolution Test Chart
| Brand | 3nh |
|---|---|
| Origin | Guangdong, China |
| Manufacturer Type | Manufacturer |
| Country of Origin | China |
| Model | NQ-10-100A |
| Price | USD 140 (approx.) |
Overview
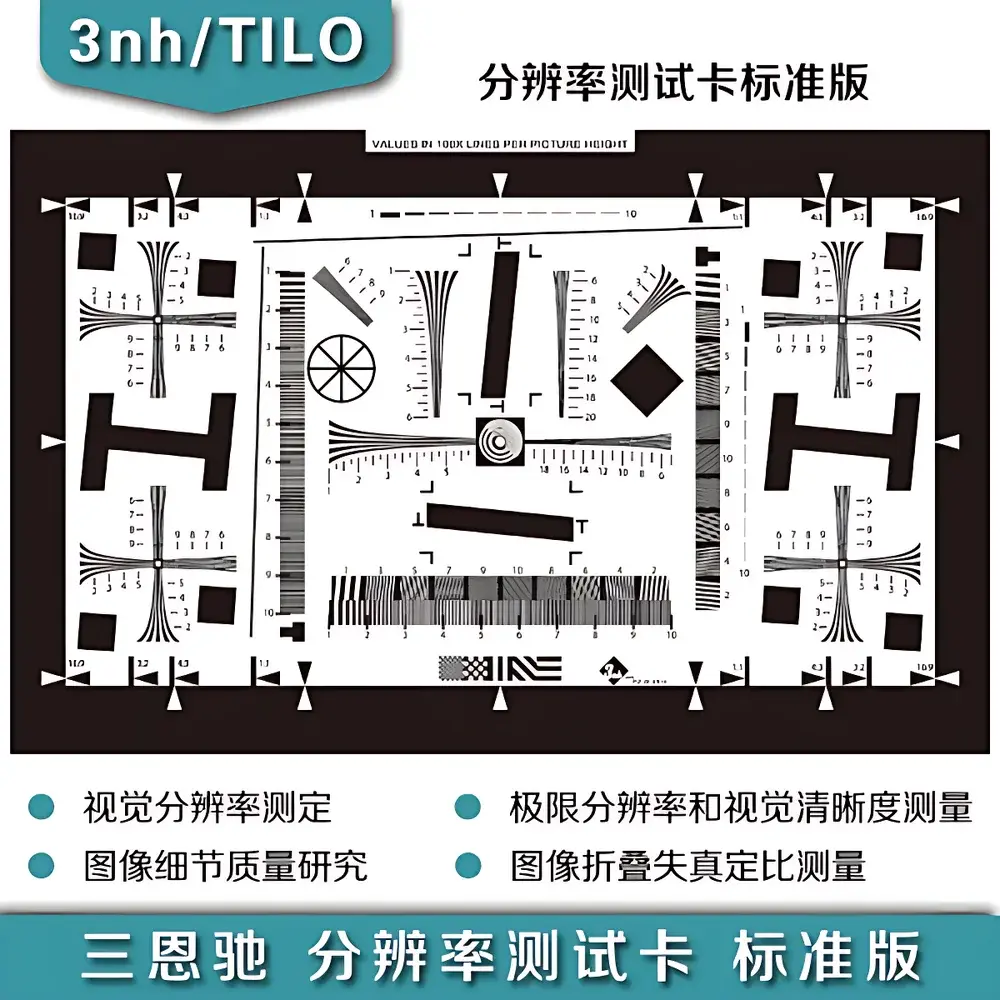
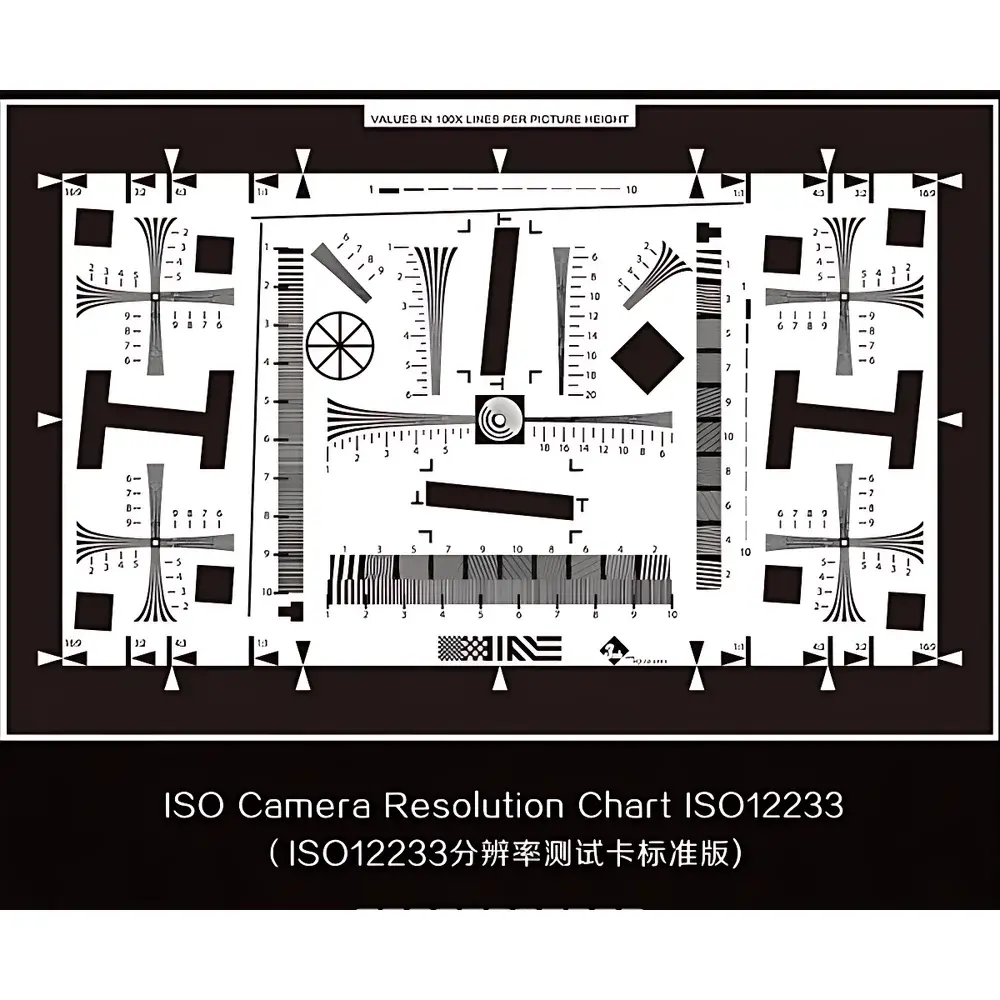
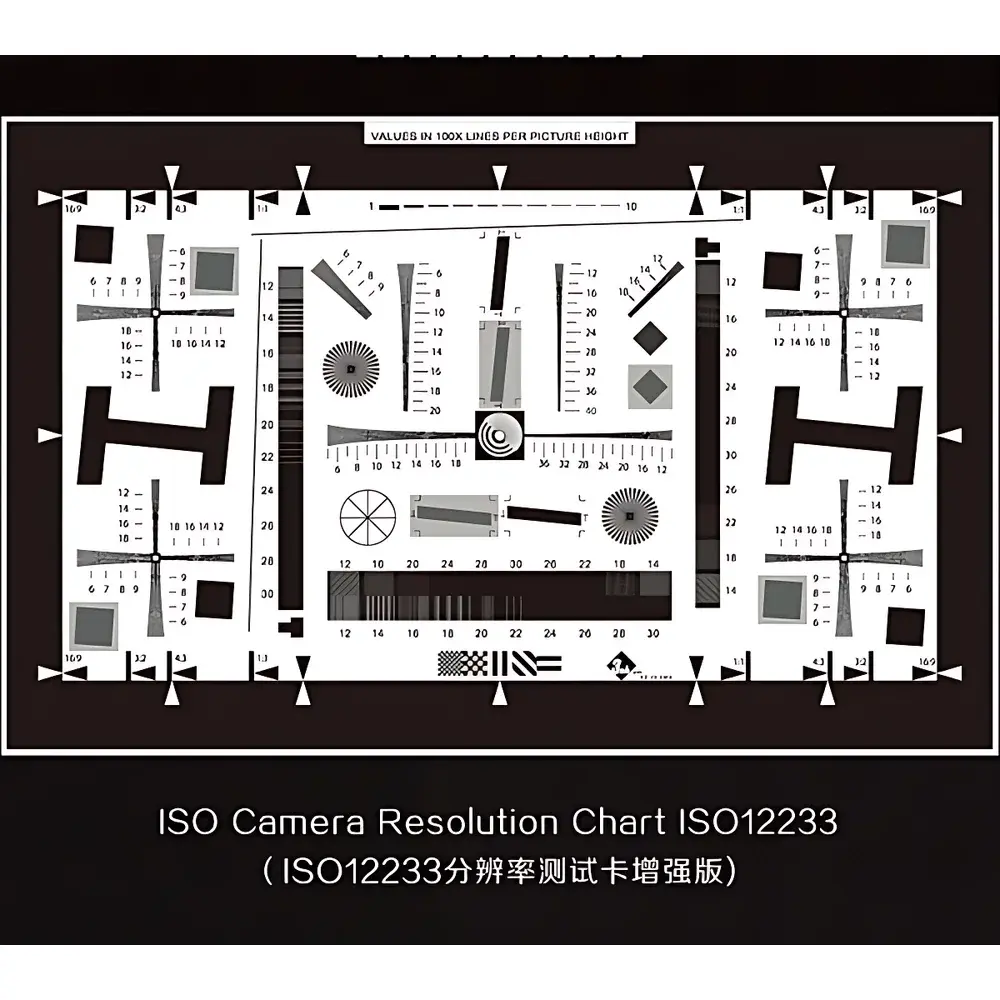
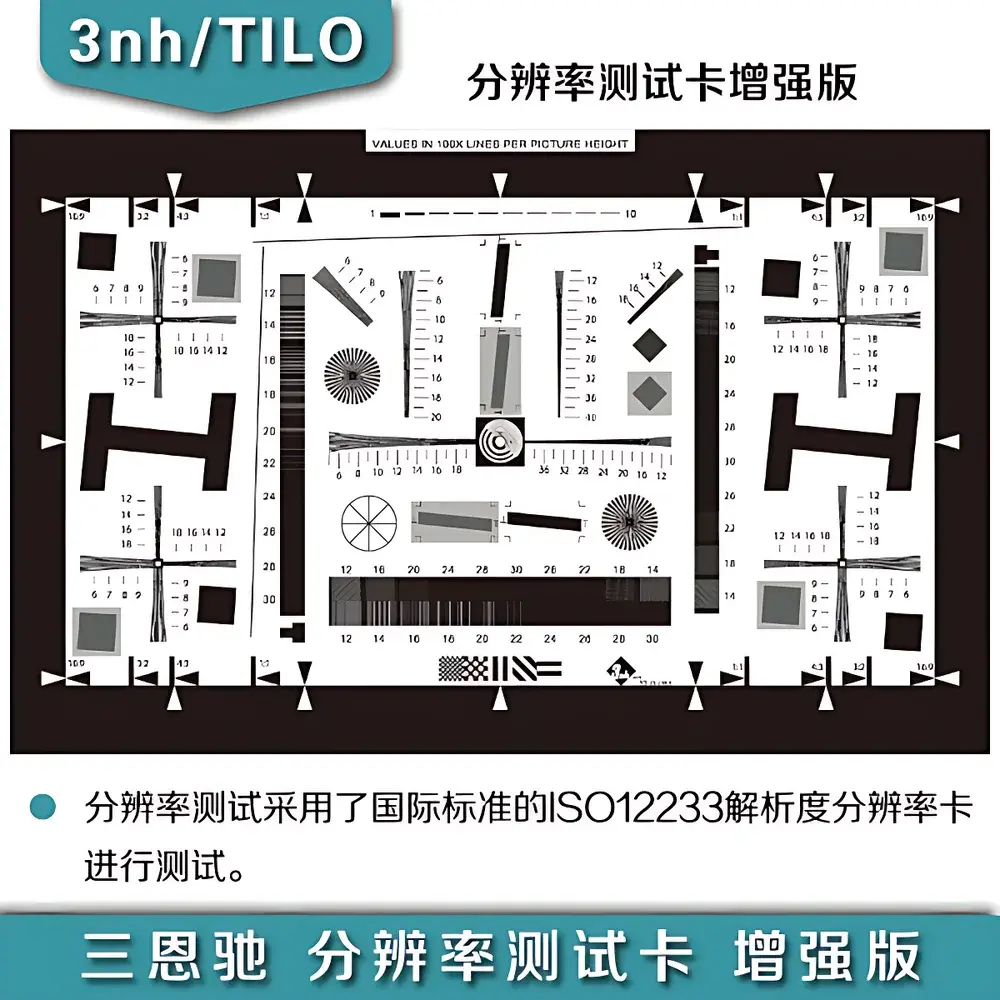
The 3nh NQ-10-100A ISO 12233 Resolution Test Chart is a precision-engineered optical reference standard designed for objective spatial resolution assessment of digital imaging systems—including industrial machine vision cameras, smartphone modules, medical endoscopes, and broadcast lenses. Conforming strictly to ISO 12233:2017 (“Photography — Electronic still picture imaging — Resolution measurements”), this chart enables quantitative evaluation of both vertical and horizontal limiting resolution via slanted-edge Spatial Frequency Response (SFR) analysis or visual wedge-based interpretation. Unlike legacy USAF 1951 charts, the ISO 12233 design incorporates high-contrast, semi-matte photographic paper substrate with calibrated line-pair density gradients across multiple spatial frequencies—optimized to minimize diffraction artifacts and reflectance non-uniformity. The NQ-10-100A variant corresponds to the 1× scale format (200 mm × 356 mm), ensuring full-frame coverage for APS-C and full-frame sensors under standardized imaging geometry.
Key Features
- ISO 12233:2017-compliant layout with slanted-edge targets, Siemens star, and multi-scale bar patterns for SFR, MTF, and visual resolution validation
- Manufactured on high-stability photographic paper with semi-matte surface finish (normative contrast ratio ≥ 40:1 per ISO 12233 Annex B)
- Precision-printed at 1200 dpi using calibrated grayscale halftoning to ensure line edge fidelity and minimal modulation loss
- Includes four auxiliary zones: low-contrast step wedges (0.05–0.95 reflectance), color patches (sRGB & Adobe RGB gamut), gray scale ramp (21-step), and geometric distortion grid
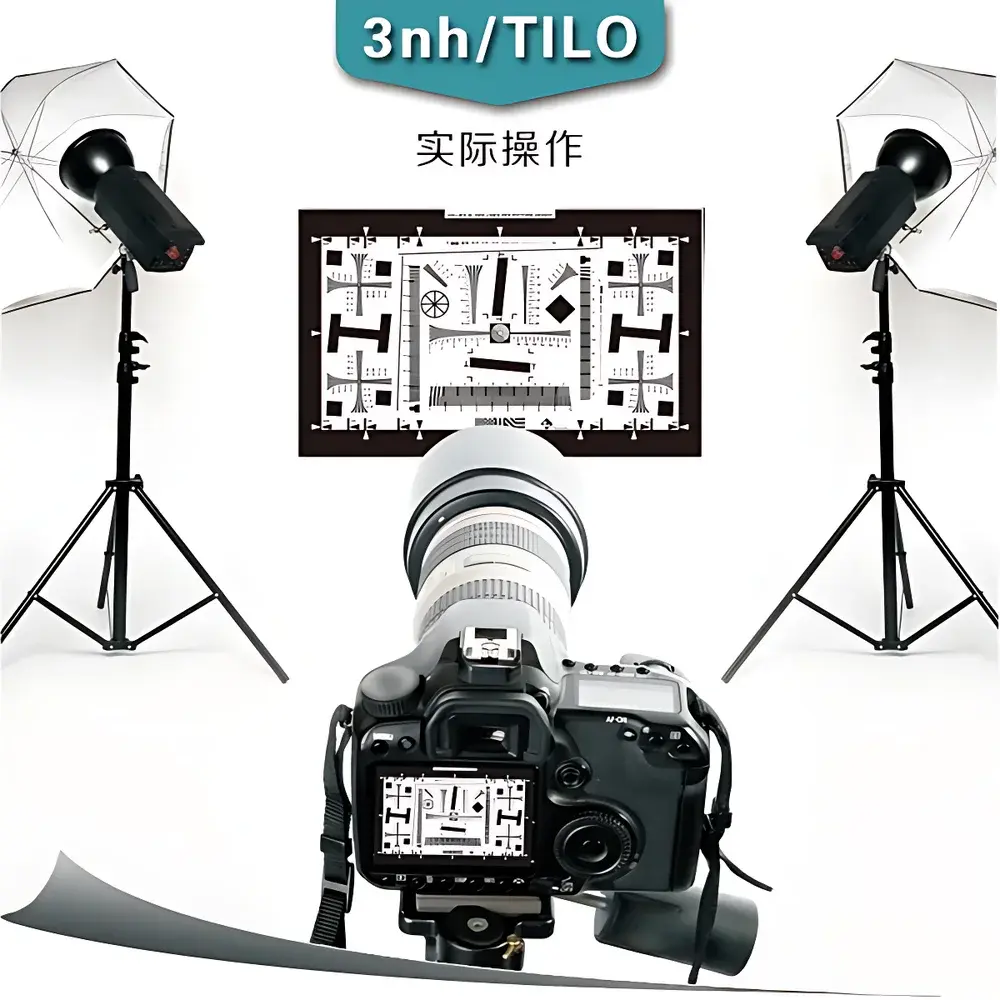
- Designed for use with standardized illumination per ISO 7589:2009—compatible with D50/D65 daylight simulators and tungsten-halogen sources (±10% illuminance uniformity across active area)
- Traceable calibration documentation available upon request; batch-specific spectral reflectance data provided for UV–VIS–NIR spectral modeling
Sample Compatibility & Compliance
The NQ-10-100A chart supports resolution characterization across sensor formats from 1/4″ CMOS to full-frame 36×24 mm. Its 1× physical dimensions align with ISO 12233’s prescribed field-of-view geometry: the active test region subtends exactly 200 mm in height when imaged at unity magnification, enabling direct pixel-to-mm mapping without interpolation. All printed features comply with ISO 12233 Annex A tolerances—line width deviation ≤ ±0.1 mm over 200 mm span. The chart satisfies requirements for GLP-compliant imaging validation workflows and is routinely deployed in ISO/IEC 17025-accredited laboratories for camera module qualification. It is referenced in ASTM E3087–21 (Standard Practice for Evaluating Digital Camera Resolution Using ISO 12233 Charts) and supports FDA 21 CFR Part 11 audit trails when used with validated acquisition software.
Software & Data Management
The chart is fully interoperable with industry-standard SFR analysis platforms including Imatest Master v6.2+, DxO Analyzer, and ISO 12233-compliant modules in MATLAB Image Processing Toolbox. When paired with 3nh’s optional HYRes software (sold separately), users gain automated slanted-edge detection, noise-weighted MTF curve generation, and ISO-defined limiting resolution extraction (defined as the spatial frequency where MTF drops to 0.05). All output reports include metadata stamping (timestamp, exposure settings, lens ID, illuminant CCT), CSV-exportable MTF tables, and PNG-based resolution heatmaps. Software workflows support traceable version control, user role-based access, and electronic signature integration for regulated environments.
Applications
- Objective resolution benchmarking of embedded camera modules during R&D and production line testing
- MTF verification of telecentric and macro lenses in metrology-grade optical assemblies
- Validation of AI-based super-resolution algorithms against ground-truth spatial fidelity metrics
- Calibration of automated optical inspection (AOI) systems in PCB and semiconductor packaging
- Regulatory submission support for IEC 62977-2-1 (Medical endoscopic imaging performance standards)
- Academic research in computational photography, particularly for aliasing and chromatic aberration quantification
FAQ
What is the difference between ISO 12233 and USAF 1951 resolution charts?
ISO 12233 uses continuous slanted-edge targets to compute SFR and MTF curves mathematically, offering higher repeatability and immunity to human observer bias. USAF 1951 relies on discrete element visibility thresholds and is prone to subjective interpretation and printer-limited resolution ceilings.
Can this chart be used for infrared or ultraviolet imaging systems?
The photographic paper substrate exhibits stable reflectance from 380 nm to 780 nm. For UV (780 nm) applications, custom quartz-glass or aluminum-coated variants are available under OEM agreement.
Is lighting uniformity critical for valid measurement?
Yes. Per ISO 12233 Clause 6.2.1, illuminance variation across the active chart area must not exceed ±10% to avoid MTF distortion due to local exposure nonlinearity.
Does the chart require recalibration over time?
No. The silver-halide emulsion on photographic paper exhibits negligible aging-induced contrast shift under ambient storage conditions (23°C, 50% RH) for up to 10 years, as verified per ISO 18934 archival stability testing.
How is limiting resolution calculated from the chart data?
Limiting resolution is defined as the highest spatial frequency (in cycles/mm at image plane) where the measured MTF value remains ≥0.05, per ISO 12233 Section 7.3. This threshold reflects the practical limit of perceptible detail under standard viewing conditions.