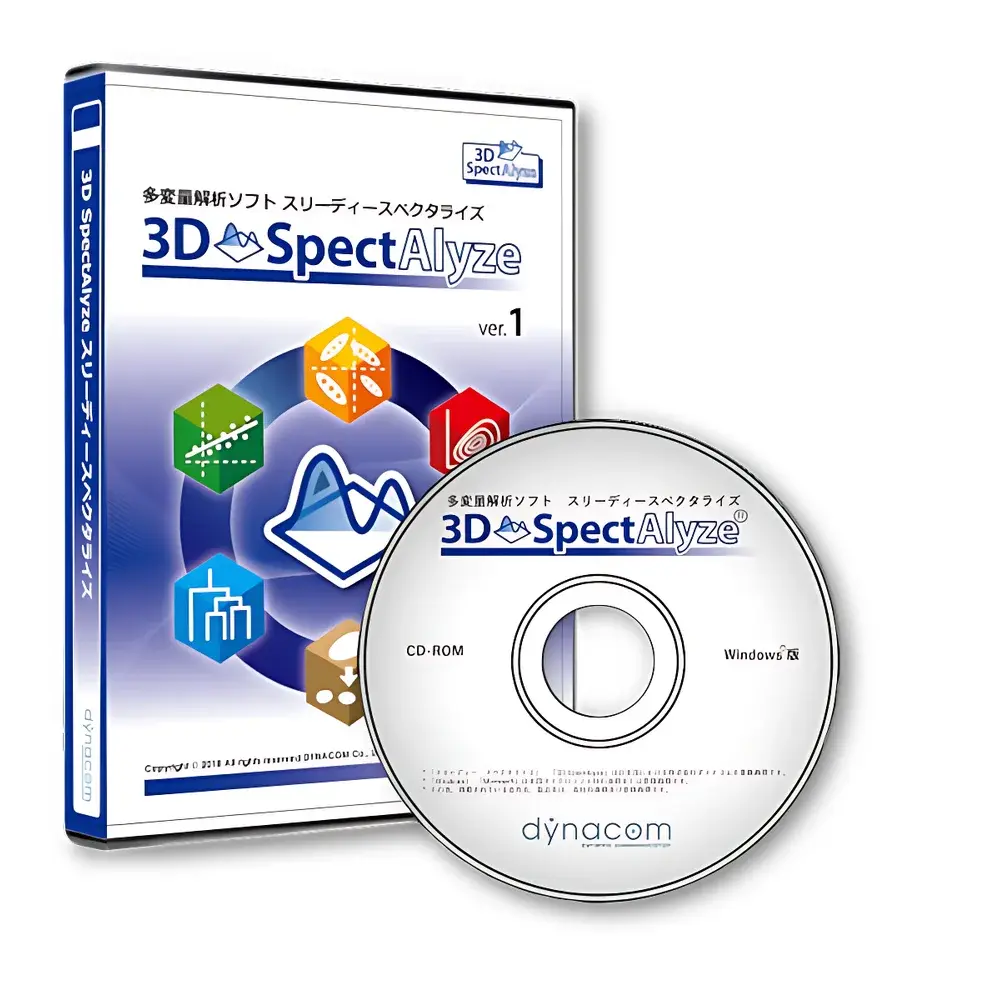
Hitachi 3D SpectAlyze Multivariate Fluorescence Data Analysis Software
| Brand | Hitachi |
|---|---|
| Origin | Japan |
| Manufacturer Type | Original Equipment Manufacturer (OEM) |
| Product Origin | Imported |
| Model | 3D SpectAlyze |
| Dispersion Element | Grating |
| Instrument Type | Steady-State Fluorescence Spectrometer |
| Software Functionality | Multivariate Curve Resolution (MCR), PARAFAC, PCA, Cluster Analysis, Discriminant Analysis, Spectral Deconvolution, ROI Masking, Stray Light Correction, Export to PNG/JPG/PDF |
Overview
3D SpectAlyze is a dedicated multivariate data analysis software platform developed by Hitachi High-Tech for comprehensive interpretation of three-dimensional fluorescence excitation-emission matrix (EEM) datasets. Designed as an integral component of Hitachi’s steady-state molecular fluorescence spectrometers—such as the F-7100 and F-4600 series—the software implements chemometric algorithms grounded in linear algebra and statistical modeling to extract quantitative and qualitative information from complex, overlapping fluorescent signatures. Unlike generic spreadsheet or scripting-based approaches, 3D SpectAlyze embeds domain-specific preprocessing workflows, constrained optimization routines, and validation protocols aligned with spectroscopic data structure, enabling reproducible identification of fluorophore classes, quantification of mixture components, and detection of subtle spectral shifts induced by environmental or compositional changes.
Key Features
- Integrated PARAFAC Modeling: Implements parallel factor analysis (PARAFAC) with automatic rank estimation, core consistency diagnostics, and rotational ambiguity assessment—supporting multi-way decomposition of EEMs across sample batches, time series, or concentration gradients.
- Multivariate Classification Suite: Includes principal component analysis (PCA), hierarchical cluster analysis (HCA), and partial least squares discriminant analysis (PLS-DA) for unsupervised pattern recognition and supervised sample classification—validated against reference standards per ISO 18562-3 and ASTM E1655 guidelines.
- Region-of-Interest (ROI) Masking & Stray Light Correction: Enables interactive definition of spectral exclusion zones (e.g., Rayleigh and Raman scatter bands) and application of empirical stray light correction models based on dark-current-subtracted reference scans.
- Spectral Deconvolution Engine: Supports constrained non-negative least squares (NNLS) fitting of user-defined or library-based pure-component spectra, facilitating resolution of co-eluting or co-excited fluorophores without prior chromatographic separation.
- Batch Processing Workflow: Allows sequential execution of preprocessing → normalization → dimensionality reduction → model training → prediction across large EEM datasets, with audit-trail logging compliant with FDA 21 CFR Part 11 requirements.
Sample Compatibility & Compliance
3D SpectAlyze processes native binary and ASCII-formatted EEM files generated by Hitachi fluorescence spectrometers (e.g., .FDB, .CSV with standardized header metadata). It supports datasets acquired under variable instrumental conditions—including variable slit widths, integration times, and excitation wavelength steps—provided wavelength calibration is traceable to NIST SRM 2034 or equivalent. The software conforms to GLP/GMP data integrity principles: all processing steps are timestamped, user-identified, and reversible via parameter file export (.PARA). Output reports include metadata fields required for ISO/IEC 17025 accreditation (instrument ID, operator, date/time, analysis parameters, uncertainty notes).
Software & Data Management
Data import is optimized for high-throughput laboratory environments: batch loading of >500 EEM files is supported with memory-mapped I/O to minimize RAM overhead. Preprocessing pipelines (baseline correction, inner-filter effect compensation, normalization to quantum yield reference) are saved as reusable templates. Analytical results—including score plots, loading vectors, residual maps, and deconvoluted component spectra—are exportable in publication-ready formats: vector-based PDF (for journal submission), lossless PNG (for presentations), and tab-delimited TXT (for downstream statistical modeling in R or Python). All exported graphics retain embedded scale bars, axis labels in SI units, and metadata tags compatible with LabArchives and Electronic Lab Notebook (ELN) systems.
Applications
- Environmental Monitoring: Quantification of dissolved organic matter (DOM) components (humic-like, protein-like, fulvic-like) in natural waters using PARAFAC-derived component scores correlated with TOC and UV-Vis absorbance indices.
- Pharmaceutical Quality Control: Detection of degradation products in parenteral formulations via PLS-DA–guided discrimination of stressed vs. control samples, aligned with ICH Q5C stability testing guidance.
- Foods & Beverages: Authentication of honey origin and adulteration screening through PCA-driven clustering of EEM fingerprints from botanical and geographic reference materials.
- Biochemical Research: Real-time monitoring of protein folding/unfolding kinetics by tracking centroid shifts in tryptophan emission contours within time-resolved EEM stacks.
FAQ
Is 3D SpectAlyze compatible with non-Hitachi fluorescence instruments?
Yes—provided EEM data are exported in standardized column-row-wavelength format (excitation × emission × intensity) with calibrated wavelength axes; custom import filters can be configured via the SDK.
Does the software support method transfer between laboratories?
Yes—analysis methods (preprocessing chains, PARAFAC constraints, classification thresholds) are saved as portable .METHOD files with embedded instrument configuration references, enabling cross-site reproducibility.
Can raw detector counts be used directly, or is correction mandatory?
Both options are available: the software accepts uncorrected counts but recommends applying dark-current subtraction and grating-efficiency correction for quantitative rigor, especially in comparative studies.
How is model validity assessed during PARAFAC analysis?
Core consistency diagnostic (CORCONDIA), split-half validation, and residual analysis against blank-corrected EEMs are automatically generated; users may set acceptance thresholds per ISO 21748 guidance on measurement uncertainty.